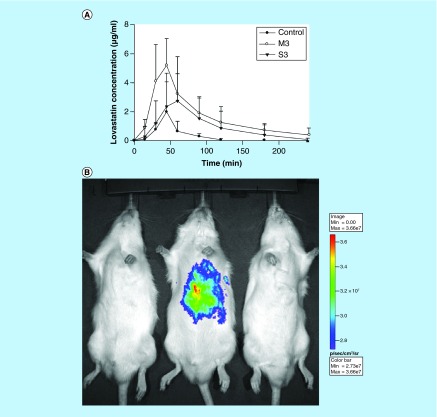
Figure 3. . Effect of type of emulsifier on oral bioavailability of lovastatin.
(A) Mean plasma concentration of lovastatin–time curves after oral administration of lovastatin to rats at a dose of 100 mg/kg from a control solution and nanostructured lipid carriers (NLC)s with M3, and S3. (B) Bioluminescence imaging of representative animals at 10 min following oral administration of sulforhodamine B in a control solution, NLCs with M3 and NLCs with S3 (left to right).
M3: Myversol; S3: Soyabean phosphotidyl choline.
Reproduced with permission from [19] © Elsevier (2010).

