Figure 2.
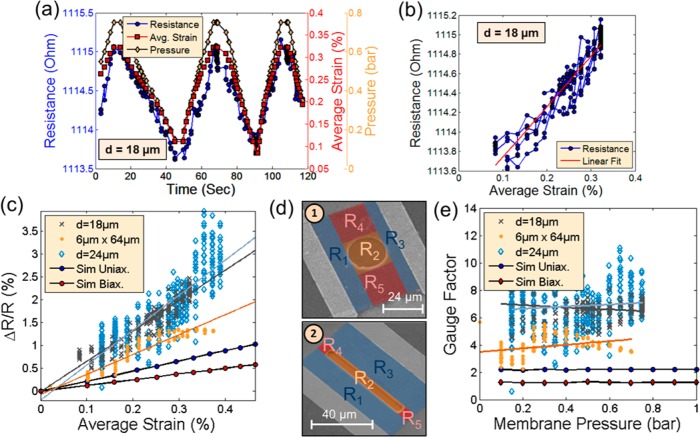
(a) Total device resistance, average strain, and vacuum chamber pressure versus time for a sensor device consisting of an 18 μm diameter graphene membrane. The resistance and pressure are taken from direct electrical readout, while the average strain is estimated with the help of a strain-deflection COMSOL FEA simulation. (b) Resistance versus strain relationship for the same device from (a). There is a linear relationship between changes in resistance and strain which is predicted by linearized Boltzmann transport simulations. (c) Percentage change in resistance of the graphene membrane area for three devices with different membrane areas as 18 μm diameter circular membrane (gray x), 24 μm diameter membrane (blue diamonds), and 6 μm × 64 μm rectangular membrane (orange dots). Results from corresponding simulations of the percentage resistance change are shown for uniaxial strain (red), corresponding to the rectangular membrane, and for biaxial strain (blue), corresponding to a circular membrane. (d) Color-coded areas of the resistors used for the equivalent resistance model for a device with a circular membrane area (1) and rectangular membrane area (2). (e) Extracted gauge factors of the different devices compared with the simulation results for both uniaxial and biaxial strained graphene membranes. Note that the gauge factors are constant regardless of the membrane pressure and the membrane diameter for the circular membranes.

