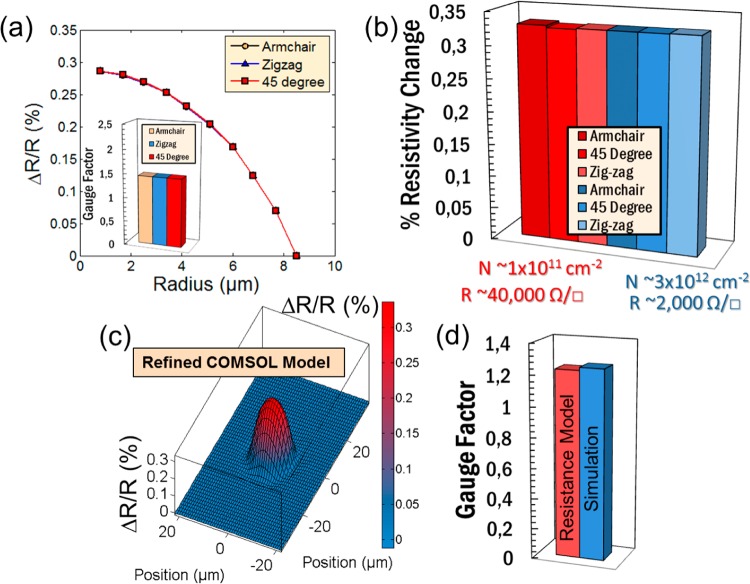
Figure 4.
(a) Membrane resistance change (ΔR/R) versus radius of graphene membranes. The strain model captures how the strain increases toward the center of a membrane (radius of 0 μm). This was performed for armchair (yellow circle), zigzag (blue triangle), and 45° (red square) directions based on (c). Virtually no impact on the orientation is observed. Inset: gauge factors extracted for the different orientations. (b) Resistivity change for different strain directions for low and high graphene doping (red and blue, respectively). Doping has virtually no effect on resistivity change. (c) Simulated map of ΔR/R over the entire graphene patch of the pressure sensor calculated with a refined COMSOL model. (d) Comparison of gauge factors extracted from the simulation in (c) using the simplified resistance model, described in the Supporting Information (red) compared to the gauge factor extracted from charge transport simulations in Figure 2d. Note that the simplified resistance model provides very close gauge factor estimation supporting the conclusion that the simplified resistance model gives a very good approximation of the gauge factor.

