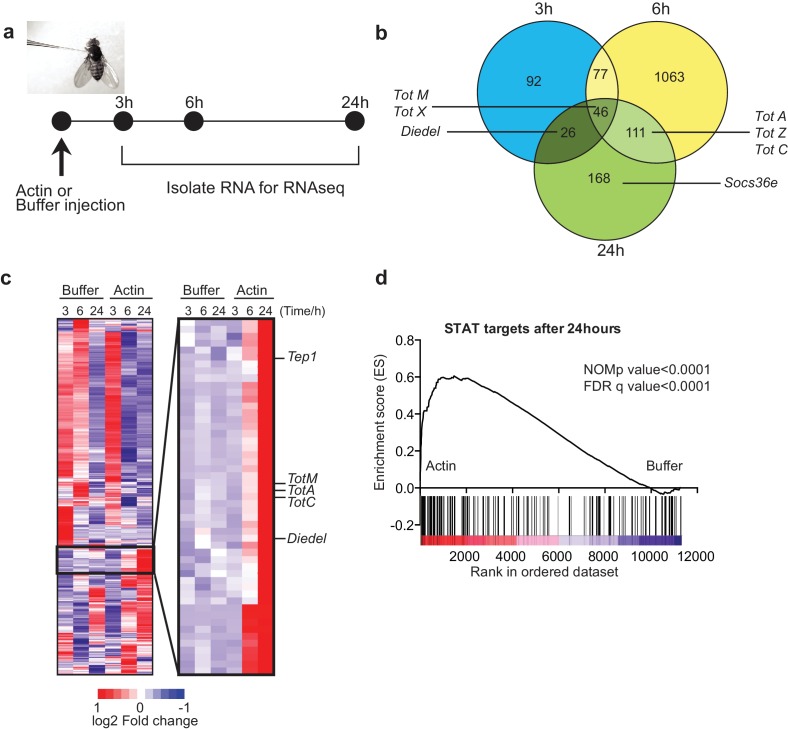
Figure 1. Global gene expression profiling reveals strong enrichment for JAK/STAT regulated genes upon actin injection.
(a) Groups of control (w1118) flies were injected with either buffer or actin before euthanasia at 3, 6 or 24 hr post injection. Flies within each group were pooled, RNA was isolated and processed for RNAseq analysis as described in the Methods. (b) Genes differentially expressed between buffer and actin-injected flies, including both up and down regulated transcripts, are represented for each time point in a Venn diagram. Only genes differentially expressed with a false discovery rate (FDR) < 0.05 were included in the analysis. The numbers within each set represent the numbers of genes differentially expressed. Select STAT target genes are indicated. (c) Differentially expressed genes between actin- and buffer-injected flies at 3, 6 and 24 hr were used to draw a hierarchical heat map. Genes were clustered using a Euclidean distance matrix and average linkage clustering. Samples were ordered based on time and treatment. The heat map shows the average expression values from triplicate samples. Red indicates higher expression and blue indicates lower expression relative to the mean expression of probes across all samples. The black box highlights genes for which there was the biggest fold change increase in actin- relative to buffer-injected flies. (d) Enrichment plot from GSEA showing that targets of STAT92E are enriched within the upregulated gene set in actin-injected files relative to buffer injected flies after 24 hr.

