. 2016 Nov 22;5:e19662. doi: 10.7554/eLife.19662

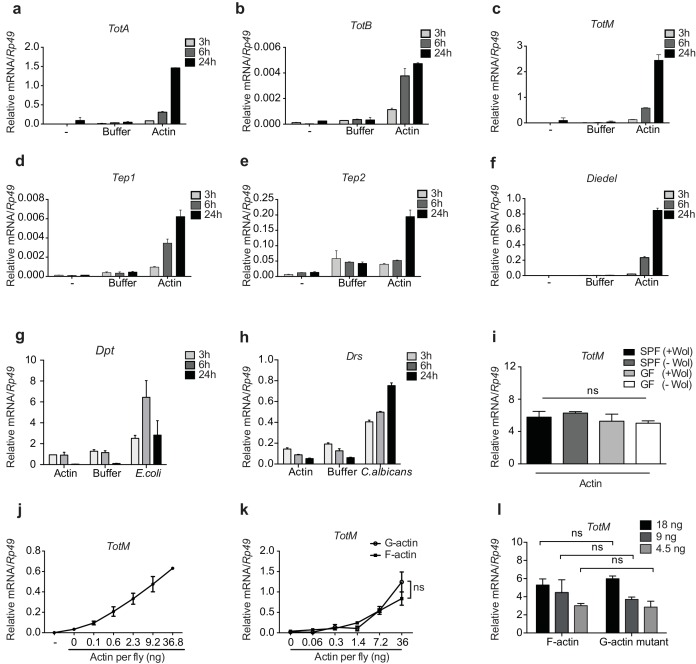
Figure 2. G- and F-actin induce a unique sterile inflammatory response upon injection into Drosophila.

Control (w1118) flies were mock treated (-) or injected with actin buffer, actin, E. coli or C. albicans, as indicated. Flies were euthanised at 3, 6 and 24 hr post injection, RNA was isolated and relative gene expression determined by quantitative RT-PCR. Depicted are expression levels of (a–c) Turandot (Tot) A, TotB and TotM, (d–e) Thioester-containing protein (Tep) 1 and Tep2, (f) Diedel, (g–h) Diptericin (Dpt) and Drosomycin (Drs). (i) Flies colonised with or free of Wolbachia (Wol) were reared under standard (SPF) or germ-free (GF) conditions. Relative TotM expression was assessed 24 hr post actin injection. (j) Dose-dependent TotM response to injected actin at 24 hr post injection. (k) Dose-response curve for latrunculin B-stabilised G-actin vs phalloidin-stabilised F-actin diluted in G-actin or F-actin buffer, respectively. Relative expression levels of TotM 24 hr post injection are shown. (l) A non-polymerisable G-actin mutant and F-actin were serially diluted in F-buffer at the indicated concentrations before injection into flies. Relative expression levels of TotM 24 hr after injection are depicted. Relative gene expression levels were calculated using the housekeeping gene Rp49 as a reference gene. Data are representative of at least two independent experiments with 10 flies/sample with duplicate samples. Bars represent mean ± SEM. Statistical analysis was performed using two-way ANOVA with Sidak’s multiple comparison test as post-test for pairwise comparisons. Results of Sidak’s multiple comparison test are shown (ns, not significant; *p<0.05; **p<0.01; ***p<0.001; ****p<0.0001). If not otherwise indicated, flies were injected with 36.8 ng of actin per fly. All data points are plotted even where no bars are visible.

DOI: http://dx.doi.org/10.7554/eLife.19662.004

Figure 2.

Figure 2—figure supplement 1. G-actin and F-actin induced TotM peaks after 24 hr.

Figure 2—figure supplement 1.

(a) Relative expression of TotM after injection with actin, buffer or after heat shock, 24 hr post treatment. Data are representative of three independent experiments with 10 flies/sample. TotM relative levels were calculated using the housekeeping gene Rp49 as a reference gene. Bars represent mean ± SEM. All data points are plotted even where no bars are visible. (b) G-actin mutant or human platelet F-actin was serially diluted in F-buffer as indicated and spotted onto nitrocellulose membranes, which were then probed with mDNGR-1 extracellular domain (which specifically recognizes F-actin but not G-actin) or mouse-anti-β-actin. Data are representative of two independent experiments.
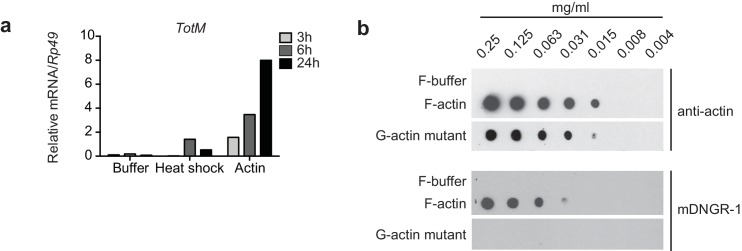
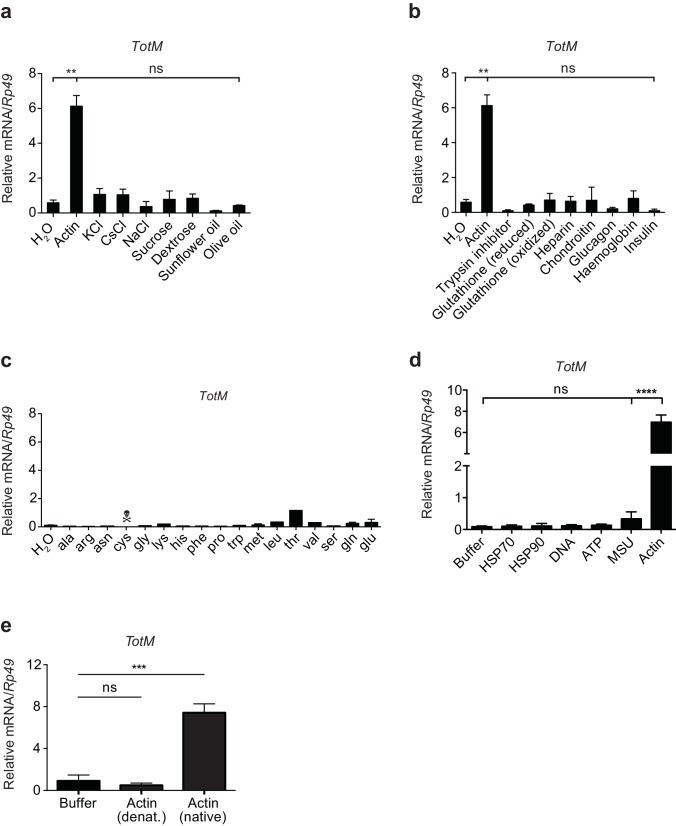
Figure 2—figure supplement 2. TotM is selectively induced by injected actin.

Figure 2—figure supplement 2.

(a) Control (w1118) flies were injected with either water or a selection of salts, sugars or lipids. Relative TotM levels 24 hr post injection are depicted. (b) Control (w1118) flies were injected with either water or different peptides or polysaccharides. Relative TotM levels 24 hr post injection are depicted. (c) Control (w1118) flies were injected with either water or amino acids. Flies injected with cysteine died in less than 24 hr. Relative TotM levels 24 hr post injection are depicted. The apparent modest increase in TotM expression after injection of threonine was not reproducible (data not shown). (d) Control (w1118) flies were injected with either buffer or a selection of vertebrate DAMPs. TotM relative levels were calculated 24 hr post injection. (e) Control (w1118) flies were injected with buffer or denatured or native actin. Relative TotM levels were measured 24 hr post injection. TotM relative levels were calculated using the housekeeping gene Rp49 as a reference gene. Data are representative of at least two independent experiments with duplicate samples. Bars represent mean ± SEM. Statistical analysis was performed using one-way ANOVA with Sidak’s multiple comparison test as post-test for pairwise comparisons. Results of Sidak’s multiple comparison test are shown (ns, not significant; *p<0.05; **p<0.01; ***p<0.001; ****p<0.0001). All data points are plotted even where no bars are visible.