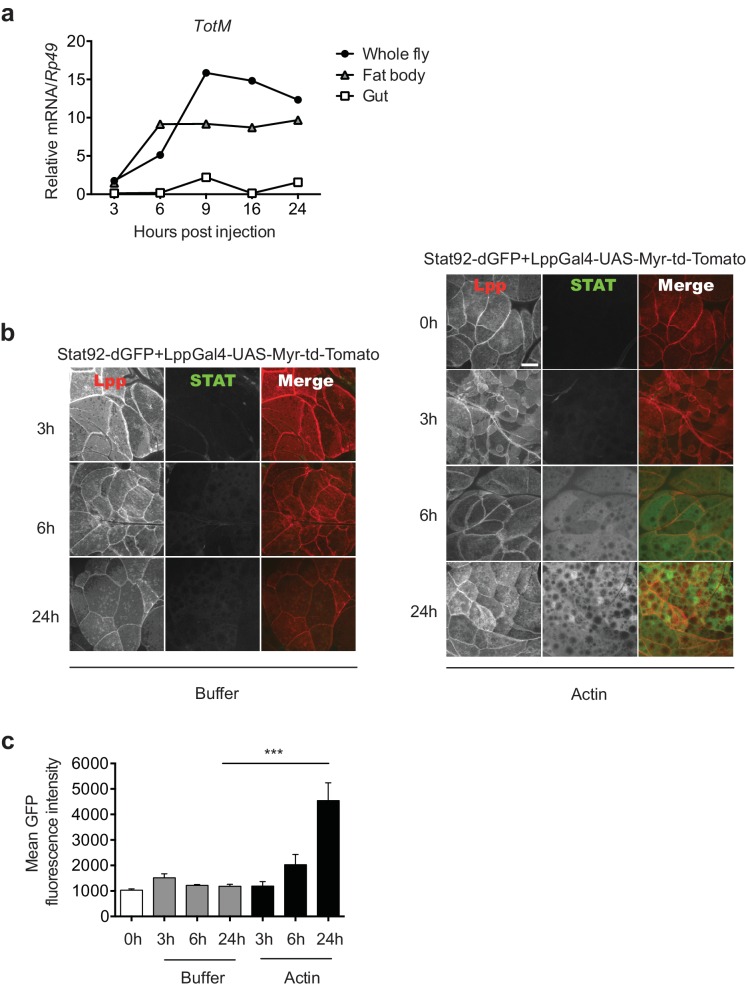
Figure 3. Actin injection induces JAK/STAT activation in the fat body.
(a) Control (w1118) flies were injected with actin and euthanised at the indicated times, after which the fat bodies and intestines were dissected and RNA extracted. Relative TotM expression in the two organs compared to whole flies is depicted. At each time point, samples represent five whole flies, 15 intestines or 15 fat bodies. TotM relative levels were calculated using the housekeeping gene Rp49 as a reference gene. (b) STAT92E reporter activity in the fat bodies of Stat92-dGFP+Lpp-Gal4 > UAS-Myr-td-Tomato flies at 3, 6 and 24 hr after injection with actin (right panel) of buffer (left panel). Scale bar represents 20 μm. (c) Quantification of mean STAT fluorescence within the fat body (n = 3–11 flies). Bars represent mean ± SEM. Statistical analysis was performed using one-way ANOVA with Sidak’s multiple comparison test as post-test for pairwise comparisons. Results of Sidak’s multiple comparison test are shown (ns, not significant; *p<0.05; **p<0.01; ***p<0.001; ****p<0.0001). All data points are plotted even where no bars are visible.

