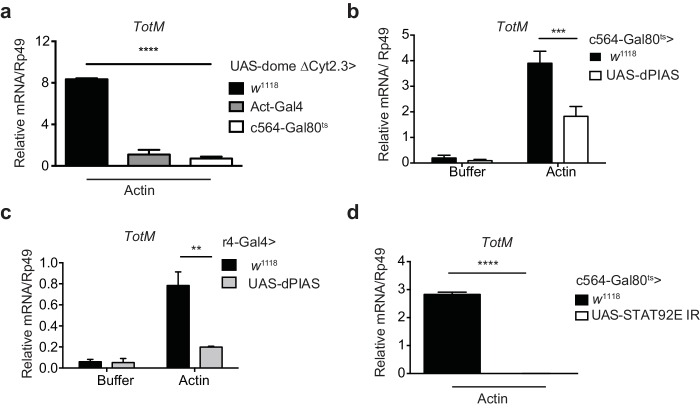
Figure 4. Extracellular actin-driven TotM expression depends on canonical Domeless signalling in the fat body.
(a) Relative TotM expression in flies overexpressing domeless ΔCyt2.3 dominant-negative isoform or no transgene (w1118 control) under the control of a ubiquitous driver, Act-Gal4, or a fat body-inducible driver c564-Gal4; Tubulin-Gal80ts (c564-Gal80ts), 24 hr after injection with actin. (b) Relative TotM expression in flies overexpressing dPIAS under the control of the fat body inducible driver c564-Gal4; Tubulin-Gal80ts (c564-Gal80ts), 24 hr after injection with either buffer or actin. Data are pooled from two independent experiments with 5–10 flies/sample and duplicate samples. (c) Relative TotM expression in flies overexpressing dPIAS under the control of the fat body constitutive driver r4-Gal4, 24 hr after injection with either buffer or actin. Data are representative of three independent experiments with 5–10 flies/sample with duplicate samples. (d) Relative TotM expression in flies overexpressing UAS-STAT92E IR under the control of the fat body inducible driver c564-Gal4; Tubulin-Gal80ts (c564-Gal80ts), 24 hr after injection with actin. Data are pooled from two independent experiments with triplicate samples and 5–10 flies/sample. TotM relative levels were calculated using the housekeeping gene Rp49 as a reference gene. Bars represent mean ± SEM. Statistical analysis was performed using two-way ANOVA with Sidak’s multiple comparison test as post-test for pairwise comparisons (a, b, c) or unpaired t-test (d). Significant differences with Sidak’s multiple comparison test or unpaired t-test are shown (ns, not significant; *p<0.05; **p<0.01; ***p<0.001; ****p<0.0001). All data points are plotted even where no bars are visible.


