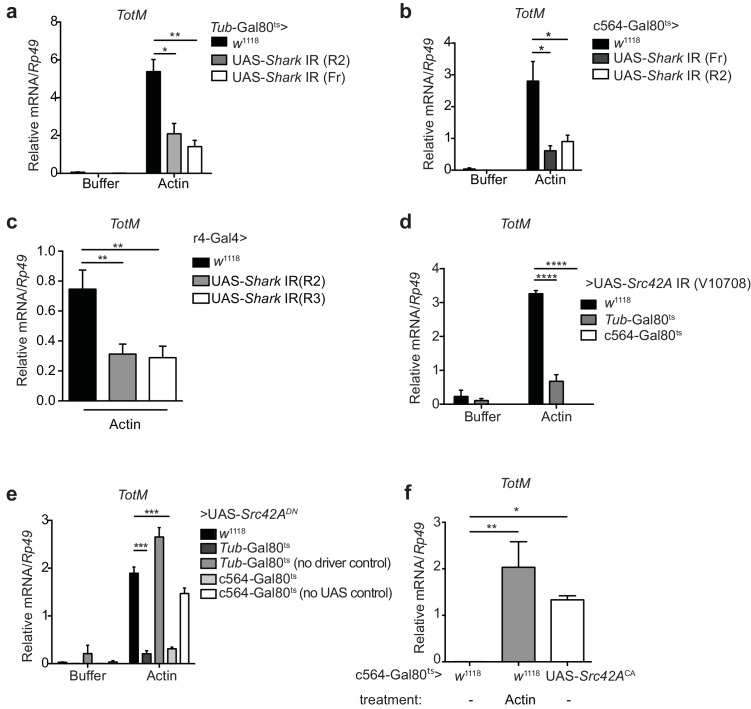
Figure 6. Extracellular actin-induced TotM expression requires Shark and Src42A in the fat body.
(a)TotM expression levels in flies that lack Shark ubiquitously (Tub-Gal80ts; Tub-Gal4 > UAS-Shark IR R2/Fr) or in control flies lacking a driver (w1118 > UAS-Shark IR R2/Fr), 24 hr after injection with either buffer or actin. Data are representative of three independent experiments with 5–10 flies/sample with duplicate samples. (b) Flies lacking Shark selectively in the fat body (c564-Gal80ts > UAS-Shark IR R2/Fr) or control flies lacking a driver (w1118 > UAS-Shark IR R2/Fr) were injected with either buffer or actin. Relative TotM levels 24 hr post injection are depicted. Data are representative of two independent experiments with 5–10 flies/sample and triplicate samples. (c) The relative TotM expression in a constitutive fat body driver line (r4-Gal4) crossed to control (w1118) or UAS-Shark IR (R2/R3), 24 hr after injection with actin. Data are representative of three independent experiments with 5–10 flies/sample and duplicate samples. (d) Relative TotM levels in flies lacking Src42A either ubiquitously (Tub-Gal80ts > UAS-Src42A IR) or selectively in the fat body (c564-Gal80ts > UAS-Src42A IR) compared to control flies lacking a driver (w1118 > UAS-Src42A IR), 24 hr after injection with either buffer or actin. Data are representative of three independent experiments with 5–10 flies/sample with duplicate samples. (e) Relative TotM levels in flies expressing a dominant negative version of Src42A ubiquitously (Tub-Gal80ts > UAS-Src42ADN), within the fat body (c564-Gal80ts > UAS-Src42ADN) or in the absence of a driver (w1118 > UAS-Src42ADN), 24 hr after injection with either buffer or actin. No driver control refers to Tub-Gal80ts; UAS-Src42ADN/TM6C.Sb1. No UAS control refers to c564-Gal4; Tub-Gal80ts/TM6C.Sb1. Data are representative of two independent experiments with 5–10 flies/sample with triplicate samples. (f) Relative TotM levels between untreated (-) fat body driver line crossed to constitutively active Src42A (c564-Gal80ts > UAS-Src42ACA); untreated control flies (c564-Gal80ts > w1118) and actin-injected control flies (c564-Gal80ts > w1118). Data are representative of three independent experiments with 5–10 flies/sample with triplicate samples. TotM relative levels were calculated using the housekeeping gene Rp49 as a reference gene. Bars represent mean ± SEM. Statistical analysis was performed using one-way (c, f) or two-way (a, b, d, e) ANOVA with Sidak’s multiple comparison test as post-test for pairwise comparisons. Results of Sidak’s multiple comparison test are shown (ns, not significant; *p<0.05; **p<0.01; ***p<0.001; ****p<0.0001). All data points are plotted even where no bars are visible.


