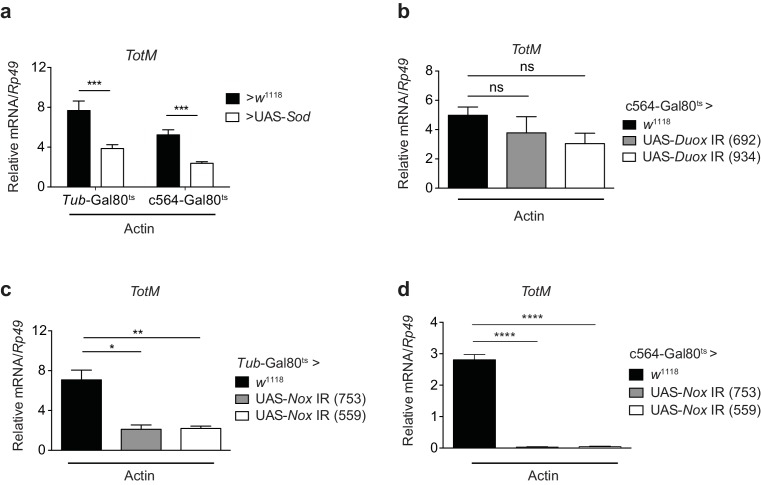
Figure 7. Extracellular actin-induced TotM expression is dependent on the NADPH oxidase Nox.
(a) Flies overexpressing superoxide dismutase (Sod) either ubiquitously (Tub-Gal80ts; Tub-Gal4 > UAS-Sod) or in the fat body (Tub-Gal80ts; c564-Gal4 > UAS-Sod) or control flies without transgene (Tub-Gal80ts; c564-Gal4 > w1118 or Tub-Gal80ts; Tub-Gal4 > w1118) were injected with actin. TotM expression 24 hr post injection is shown. In order to increase statistical power, data were pooled from two independent experiments with 5–10 flies/sample and quadruplicate samples. (b) TotM expression levels 24 hr post actin injection in flies in which Duox was knocked down in the fat body (Tub-Gal80ts; c564-Gal4 > UAS-Duox IR). Data are representative of two independent experiments with 5–10 flies/sample and triplicate samples. (c–d) TotM expression levels in flies in which Nox was knocked down either ubiquitously (c) (Tub-Gal80ts; Tub-Gal4 > UAS-Nox IR) or in the fat-body (d) (Tub-Gal80ts; c564-Gal4 > UAS-Nox IR) compared to control flies lacking RNAi (Tub-Gal80ts; Tub-Gal4 > w1118 or Tub-Gal80ts; c564-Gal4 > w1118), 24 hr after injection with actin. Data are representative of two independent experiments with 5–10 flies/sample and triplicate samples. TotM relative levels were calculated using the housekeeping gene Rp49 as a reference gene. Bars represent mean ± SEM. Statistical analysis was performed using one-way ANOVA with Sidak’s multiple comparison test as post-test for pairwise comparisons. Results of Sidak’s multiple comparison test are shown (ns, not significant; *p<0.05; **p<0.01; ***p<0.001; ****p<0.0001). All data points are plotted even where no bars are visible.

