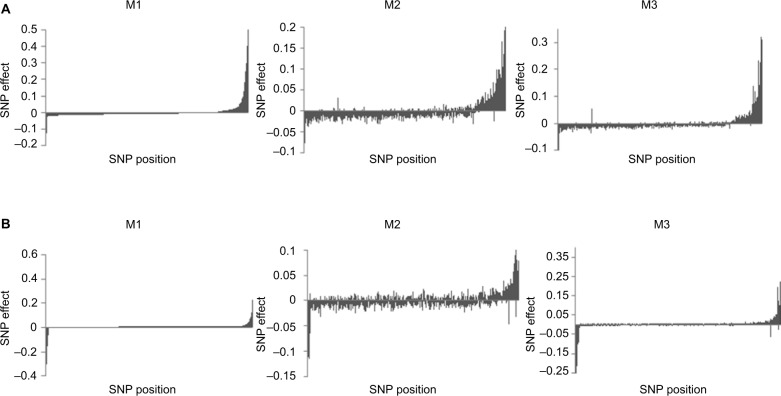
Figure 4.
Distribution of SNP effects for 7% and 3% misclassification rates. The effects are sorted in decreasing order based on estimates using M1 when odds ratios of influential SNPs are moderate (A) and extreme (B). M1: true data analyzed with a standard model. M2: noisy data analyzed with threshold model ignoring misclassification. M3: noisy data analyzed with threshold model contemplating misclassification (proposed method).
Abbreviation: SNP, single nucleotide polymorphism.

