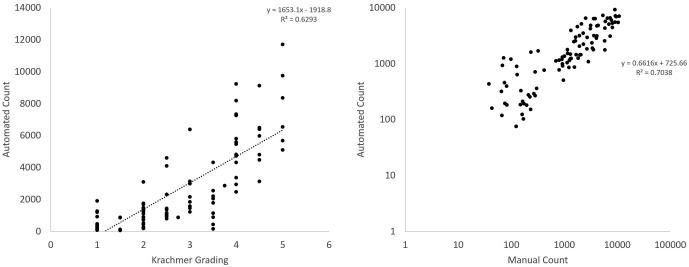
Figure 2.
Comparison of mean automated count of guttae with Krachmer score and manual counts. Krachmer Grading versus mean automated count of guttae using retroillumination photography analysis (left) shows strong correlation (R2= 0.6293). Automated counts of guttae were also strongly correlated with manual counting (right, R2=0.7038).

