
Figure 1.
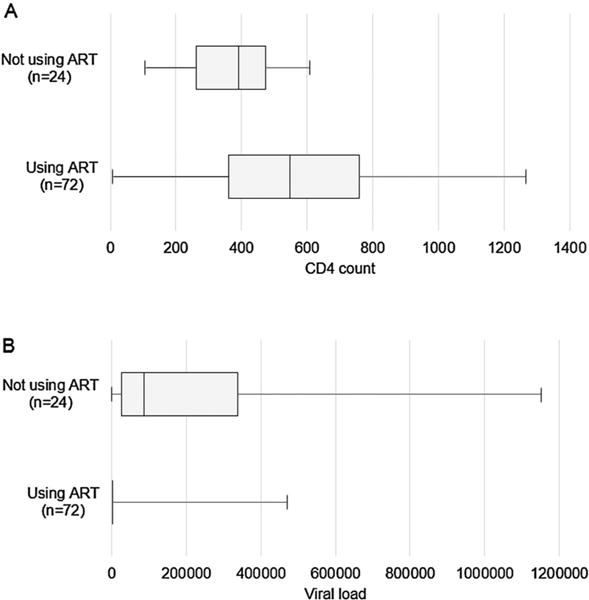
CD4 count (a) and viral loads (b) at the time of cross-sectional survey by reported ART use among ART-eligible HIV-infected FSW (n = 96); box plots showing median (line), interquartile range (IQR; box), minimum (lower whiskers), and maximum (upper whiskers). ART = antiretroviral therapy