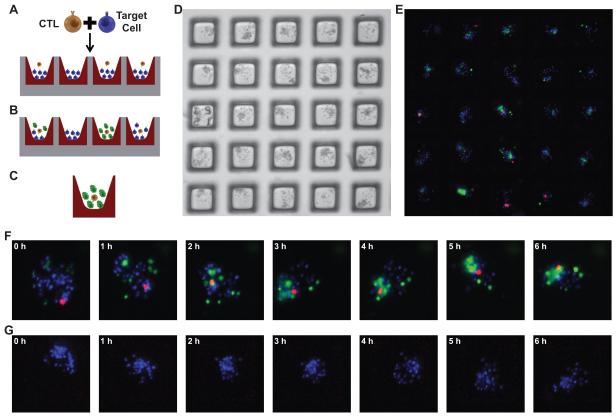
Figure 2. Design of T cell mediated cytotoxicity assay.
The microraft array was designed to identify the best M1p specific CTLs. The arrays were loaded with Hoechst labeled “target” cells (peptide pulsed DCs) at a density of 30 cells per microraft and co-incubated with CTLs from an M1p culture at a mean density of 1 cell per microraft. (Figure 2A). Over time target cells die and take up Sytox Green that is present in the media (Figure 2B). Microrafts with the greatest increase in green fluorescence are identified as likely having the most cytotoxic T cells (Figure 2C). Both the targets and T cells distribute into the microrafts according to the Poisson distribution. A 5 × 5 microraft array shows multiple different ratios of cells throughout the array (Figure 2D, E). Fluorescence images for 2 of the 4900 microrafts are shown at 1 h time points (images were collected every 30 min). A microraft with 1 CTL (red cell) shows increased killing (green fluorescence) over time (Figure 2F), and another microraft without a CTL shows no killing over time (Figure 2G).

