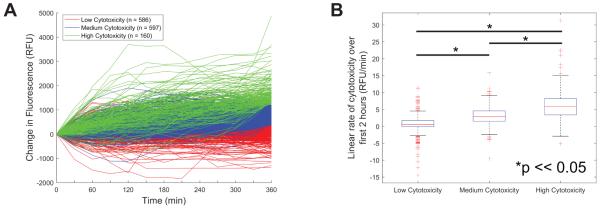
Figure 5. Single CD8+ T cell cytotoxicity rates.
Data from microrafts containing a single CTL were clustered using the K-medoids algorithm. The data were clustered into three groups based on the total change in green fluorescence (Sytox Green) from 0 to 6 h normalized to the area of target cells (Hoechst+ fluorescence). These clusters were labeled as “Low Cytotoxicity” (n = 580), “Medium Cytotoxicity” (n = 603), and “High Cytotoxicity” (n = 160) (Figure 5A). A linear fit was performed on the first 2 h of the fluorescence/cytotoxicity data (first 5 time points). There was a statistically significant difference in the slope of the fits for all identified clusters. This indicates that it may be possible to separate Low, Medium and High cytotoxicity after the first 2 h of a cytotoxicity assay (Figure 5B).

