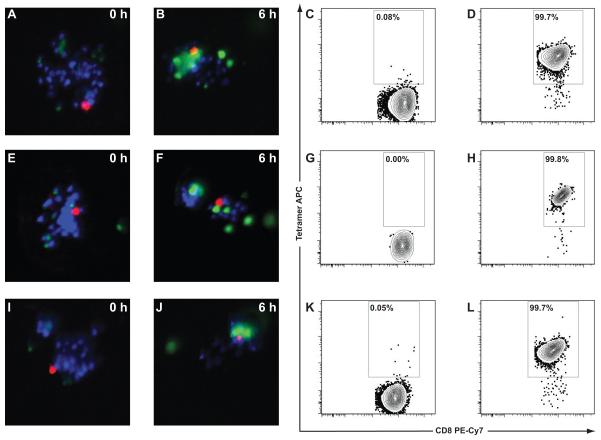
Figure 6. Isolation and expansion of T cells based upon cytotoxicity.
The CTLs from the M1p array with the greatest measured cytotoxicity were sorted using the microraft release device into a 96-well plate and allowed to clonally expand for 2 weeks. Three clones expanded: CTL3-MR-B8 (Figure 6A-D), CTL3-MR-D10 (Figure 6E-H), and CTL-MR-F9 (Figure 6I-L). The t = 0 and t = 6 h fluorescence for each of their respective microrafts are shown (Figure 6A-B, E-F, I-J). After clonal expansion TCR avidity for M1p/HLA-A*02:01 tetramer was measured. Negative tetramers were again used to define the tetramer gate (Figure 6C, G, K), and all 3 clonal populations had high avidity interactions with M1p/HLA-A*02:01 tetramer (Figure 6D, H, L). Tetramer staining was analyzed by gating on live cells (DAPI negative), lymphocytes (FSC vs SSC), and CD8+Lineage− cells. Only the CD8+Lineage− cells are shown on the plots.

