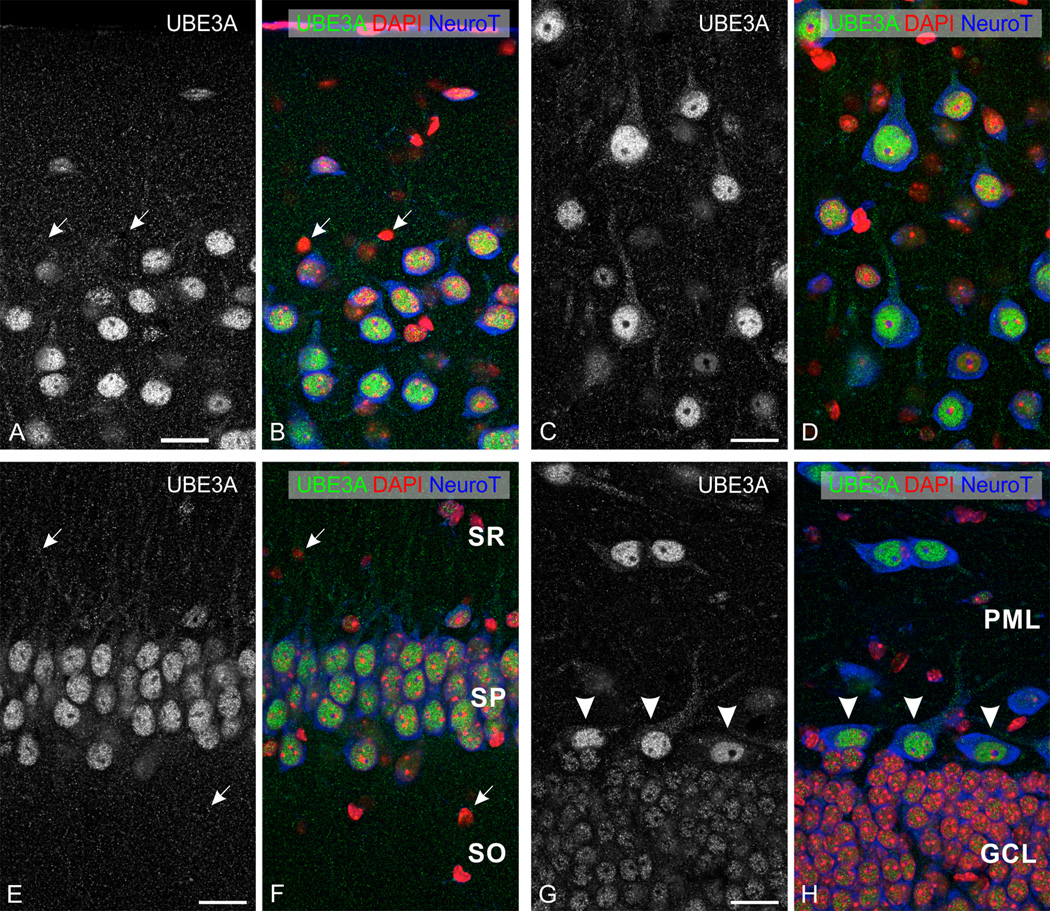
Figure 2.
Higher magnification view of immunofluorescence staining for UBE3A in neocortex (top row) and hippocampus (bottom row). Sections were counterstained with DAPI (red) to visualize nuclei, and with NeuroTrace 640–660 (blue) to visualize neuronal somata. A, B: cerebral cortex (primary visual cortex, layer I-II); C, D: cerebral cortex (primary visual cortex, layer V); E, F: CA1 hippocampus; and G, H: dentate gyrus. White arrows point to small non-neuronal cells with little to no staining for UBE3A. Arrowheads in G, H point to hilar mossy cells. SO, stratum oriens; SP, stratum pyramidale; SR, stratum radiatum; GCL, granule cell layer; PML, polymorphic cell layer. Scale bars= 20 µm.

