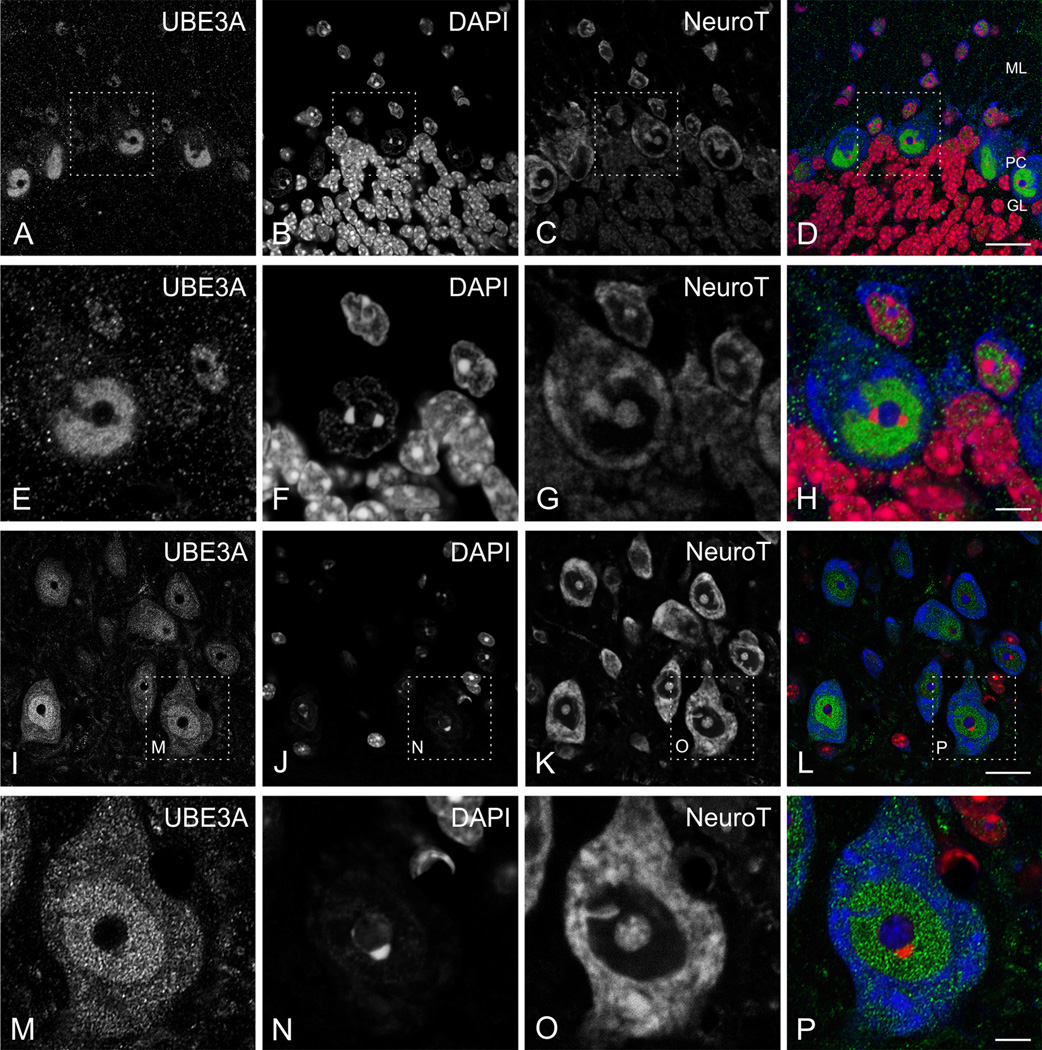
Figure 5.
High magnification immunofluorescence, showing UBE3A in cerebellar cortex (A–H) and gigantocellular reticular nucleus (I–P). Sections were counterstained with DAPI (red) to visualize nuclei, and with NeuroTrace 640–660 (blue) to visualize neuronal somata. Scale bar = 20 µm in A–D and I–L; 5 µm in E–H and M–P.

