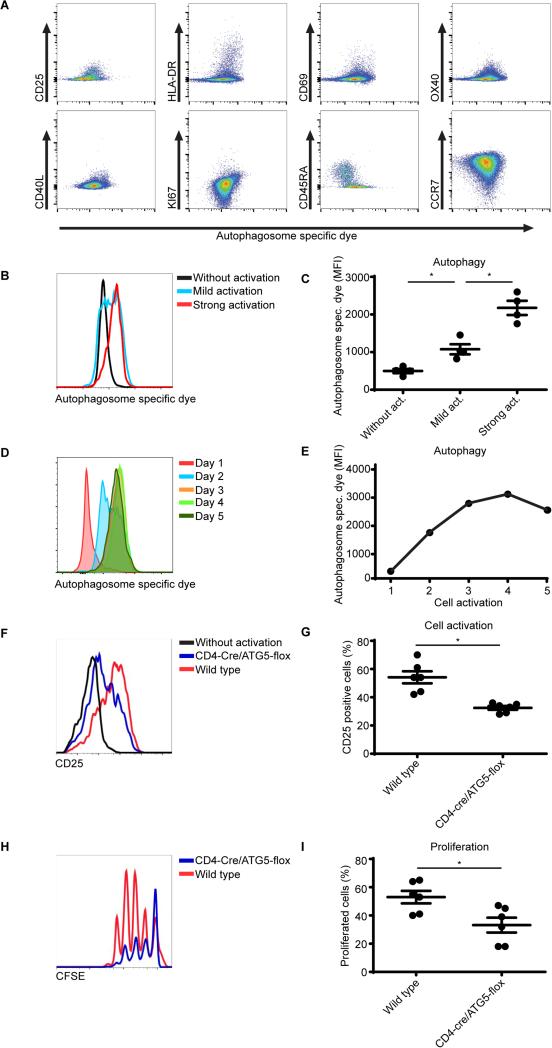
Figure 3. The autophagic flux in activated CD4+ T cells from RA patients.
(A) CD4+ T cells from RA patients were cultured in the presence of 10 μM hydroxychloroquine (HCQ) for 18 hours. Cells were stained for autophagosomes and CD25, HLA-DR, CD69, OX40, CD40L, KI67, CD45RA and CCR7. (B) Sorted CD4 T cells cultured in the presence of anti-CD3/28 coated beads (mild activation 1 bead/5 cells, strong activation 3 beads/1 cell). Autophagosomes were stained and analyzed by flow cytometry (n=4). (C) Quantification of (B). (D, E) PBMCs were activated utilizing aCD3/CD28 coated beads (1:1 ratio) for 24 hours. The beads were then removed and every day autophagy was assessed within the CD4+ T cell population. (F) CD4+CD25− T cells were sorted from the spleen of wild type or CD4-cre/ATG5-flox mice and cultured in the presence of anti-CD3 and antigen presenting cells for 24 hours and CD25 expression was analyzed by flow cytometry (n=6). (G) Quantification of (F), 6 mice per group. (H) CD4+CD25− T cells were sorted from the spleen of wild type or CD4-cre/ATG5-flox mice and cultured in the presence of anti-CD3 and antigen presenting cells for 72 hour. Proliferation was determined by CFSE dilution (n=6). (I) Quantification of (H). * p<0.05.

