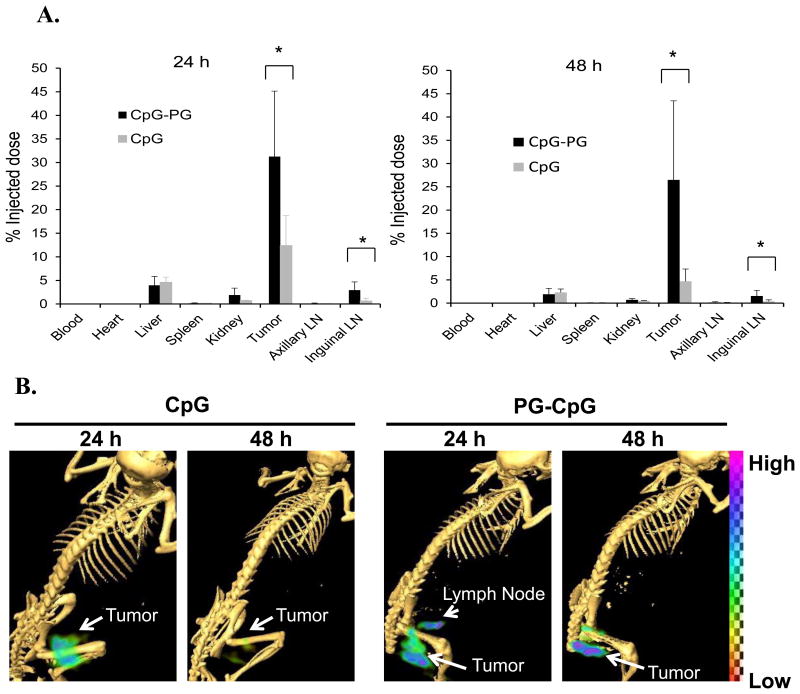
Figure 4. Biodistribution and imaging of CpG-PG and CpG in tumor and major organs.
C57BL/6 mice bearing B16-OVA melanoma tumors 6-8 mm in diameter were divided into 2 groups with 6 mice each. 111In-CpG or 111In-PG-CpG was injected directly into the tumor. (A) Biodistribution of CpG-PG and CpG. Data are expressed as percentage of injected dose (%ID), represented as mean ± standard deviation. Significantly more 111In-CpG-PG than 111In-CpG was retained in the tumor and the draining lymph nodes (LNs). *p<0.05. (B) Representative SPECT/CT images of mice (n = 3) 24 h and 48 h after intratumoral injection of 111In-PG-CpG and 111In-CpG, showing the site and amount of the radiotracer retained in tumor and tissue.

