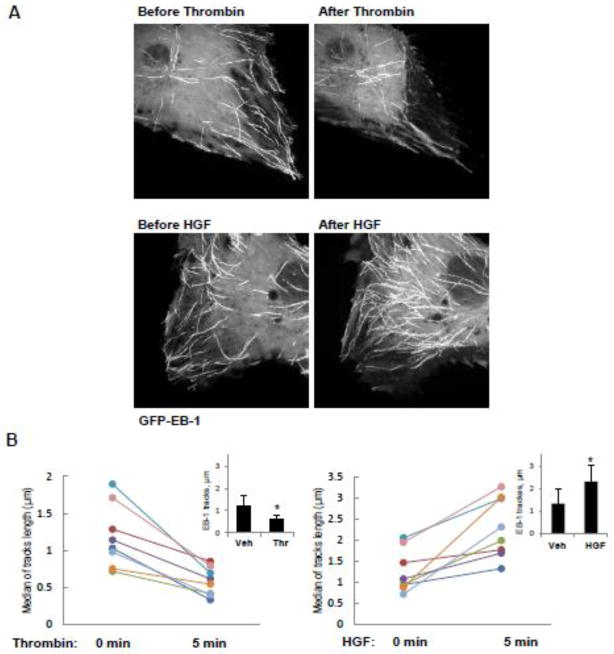
Figure 3. Effects of thrombin and HGF on MT growth.
A and B - Live cell imaging of HPAEC transfected with GFP-EB1 and stimulated with thrombin (0.3 U/ml, 10 min) or HGF (50 ng/ml, 10 min). Projection analysis of 20 consecutive images before and after treatment is shown (A). Graphs depict quantification of GFP-EB1 track length. Each pair of dots represents the median track length in a cell before and after thrombin or HGF stimulation (B). Insets: Bar graphs represent agonist-induced changes in EB1 tracks. Data are expressed as mean ± SD of four independent experiments, 6–8 cells for each experiment; *p<0.05.

