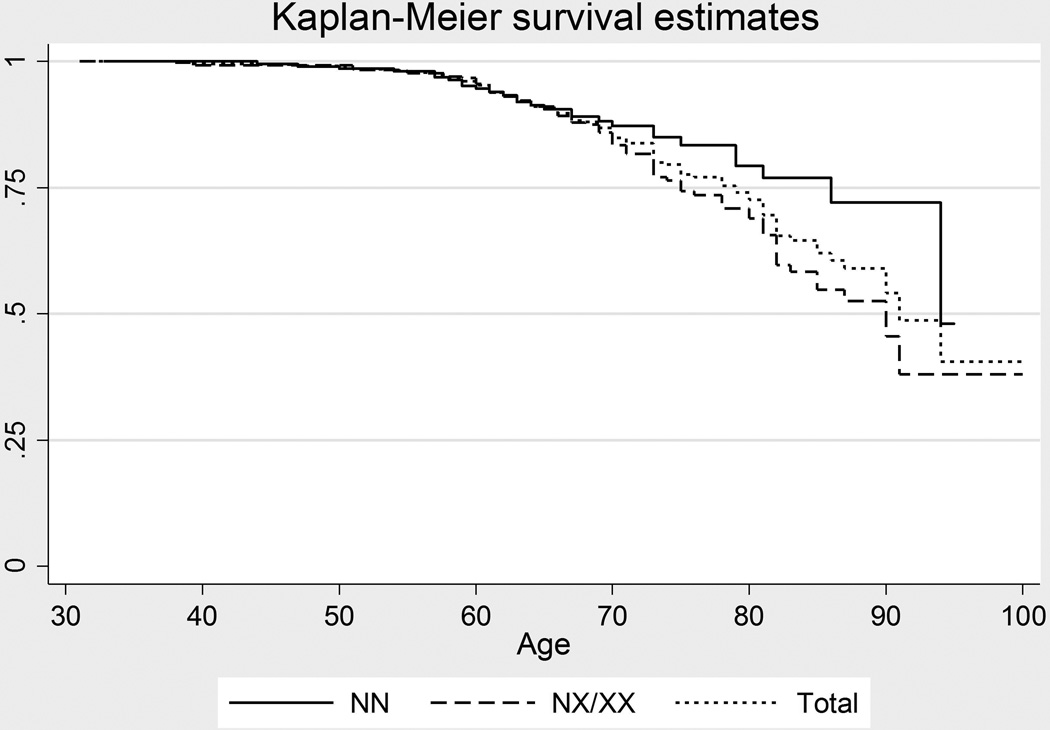
Figure 2.
Estimated survival curves depicting relative differences in age of surgery between patients with less than 40 repeats (NN) vs. greater than 40 repeats in either allele (NX/XX), constructed from clinical data. Cox proportional hazard regression model demonstrates a significant difference in survival function (p=0.027), with hazard ratio of 1.64 (95% CI, 1.05 to 2.55) but without significant association with gender (p=0.747).

