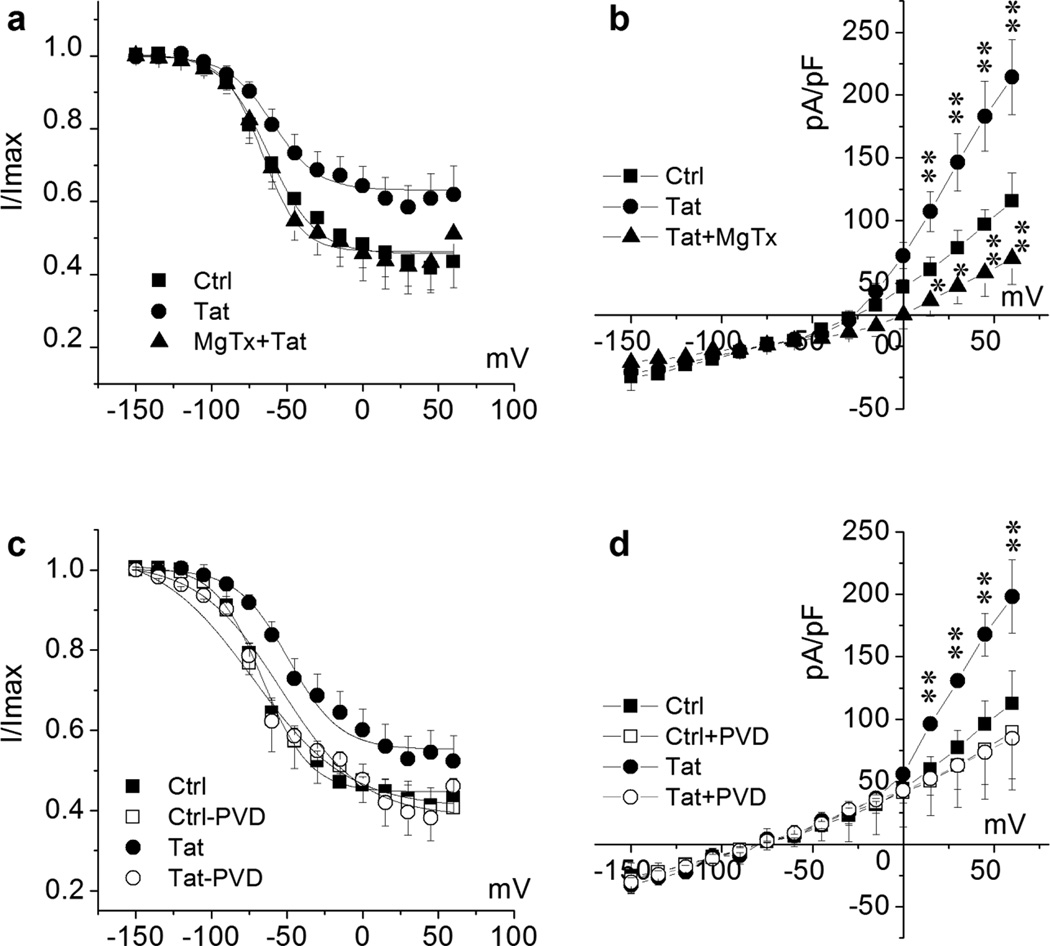
Figure 9. Tat alteration of KV1.3 channel inactivation and channel phosphorylation regulation.
For channel inactivation analysis, recoded cells were held at −80 mV during voltage-clamping. K+ channels were pre-activated by voltage steps from −150 mV to +60 mV with 15 mV increments and then tested at the depolarization pulse of +40 mV. Data are expressed as mean ± S.E.M.. Normalized data points were fitted with the Boltzmann equation: I/Imax=1/{1+exp[(V-V1/2)/k]}. Cultured Ols were treated with Tat (50 ng/ml) for 2 h prior to recording. Non-treated Ols were recorded as control (Ctrl). Panels a and b, Tat-treated cells were recorded before (Tat) and after (Tat + MgTx) application of 10 nM MgTx in the bath. Fitted inactivation curve of each group as indicated is shown in Panel a. n = 8 in each group. V1/2 of Tat was −57.99 ± 2.23 mV compared with −62.39 ± 1.79 mV in Ctrl; and V1/2 was −66.41 ± 2.03 mV in Tat + MgTx, indicating an involvement of KV1.3 in Tat-mediated right shift of the inactivation curve. MgTx blocked Tat-enhanced total outward K+ current density (Panel b). Panels c and d illustrate that bath application of PVD (200 µM), a tyrosine phosphatase inhibitor, blocked Tat-induced right-shift of inactivation curve (Panel b) and Tat-mediated increase of mean peak current density as plotted in the I-V curves in Panel c (n = 6), demonstrating that Tat may enhance Ol KV1.3 current by downregulation of phosphorylation of KV1.3 tyrosine residues. Fitted inactivation curve of each group in Panel b as indicated (n = 6). V1/2 of Tat-treated group was −49.06 ± 2.62 mV in comparison with −66.32 ± 1.46 mV of Ctrl. V1/2 of Tat-PVD group was −65.01 ± 4.53 mV compared with −66.60 ± 3.78 mV of Ctrl-PVD. * p < .05 vs. Ctrl, ** p < .01 vs. Ctrl.

