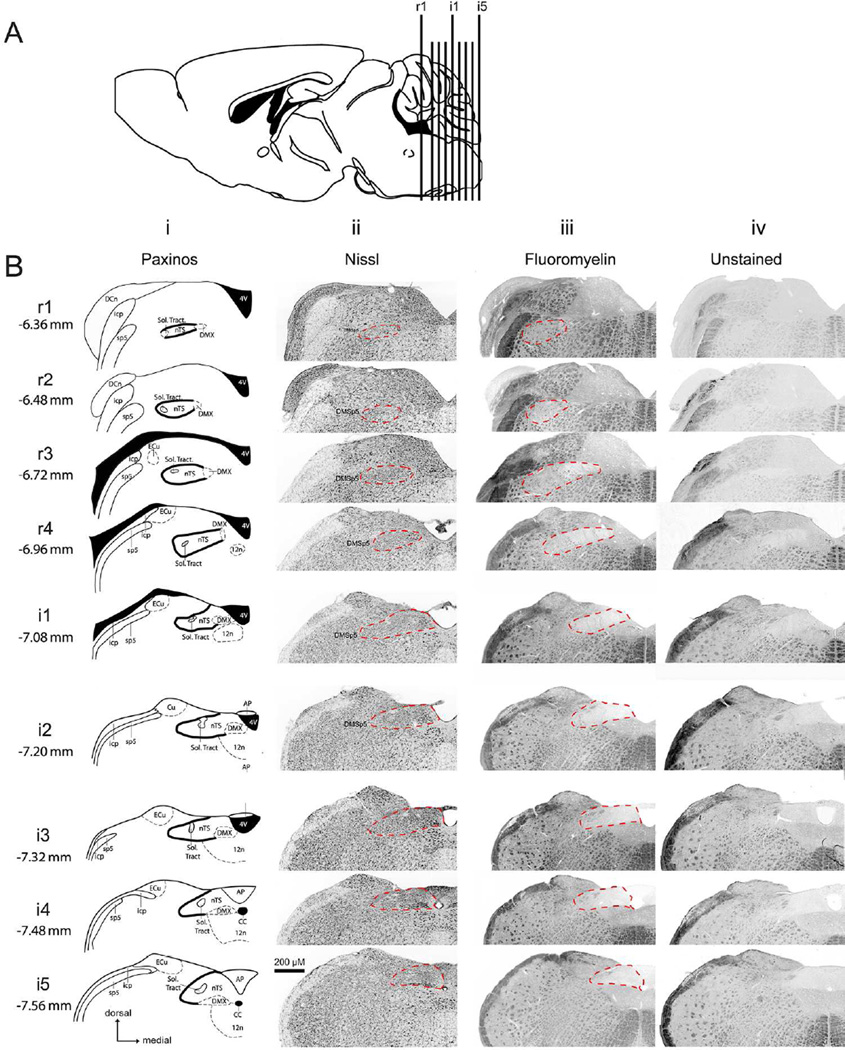
Figure 1. Rostral-caudal boundaries of nTS based on various staining methodologies.
A: Nine standard transverse section planes as projected onto a parasagittal section of a mouse brain. B: Nine rostrocaudal nTS levels designated as rostral (r1 – r4) and intermediate (i1- i5). Coordinates from Bregma are listed for each nTS level. For each level the boundary of nTS is indicated to permit comparison between: Column i, the Paxinos Atlas (solid black line); Column ii, fluorescent Nissl staining (dashed red line); Column iii, FluoroMyelin staining (dotted red line); and Column iv, Unstained sections (dotted red line). The location of the dorsomedial trigeminal nucleus (DMSp5) is also indicated. Atlas images modified from 2nd edition of The Mouse Brain in Stereotaxic Coordinates (Paxinos and Franklin, 2001).

