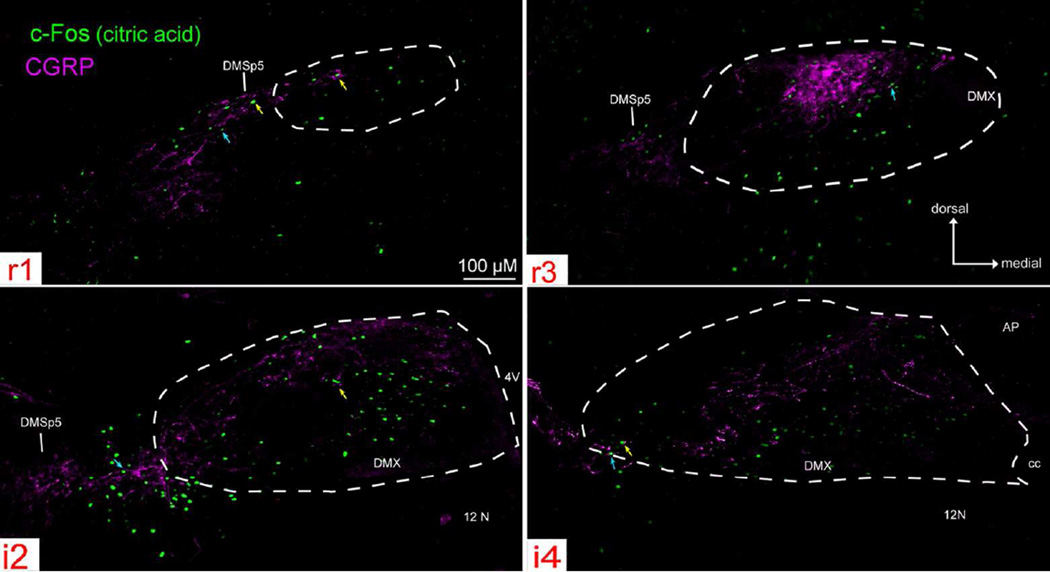
Figure 10. Citric acid- evoked c-Fos-like Immunoreactivity (Fos-LI) within the brainstem of ‘Control’ (P2X WT) mice across four representative nTS levels (r1, r3, i2, i4).
Photographs of citric acid-evoked c-Fos (green) and CGRP (magenta) staining, with nTS boundaries indicated as white dotted lines. Citric acid-evoked c-Fos positive cells lie primarily in areas that contain CGRP immunoreactive fibers (blue arrows) or terminals (yellow arrows).

