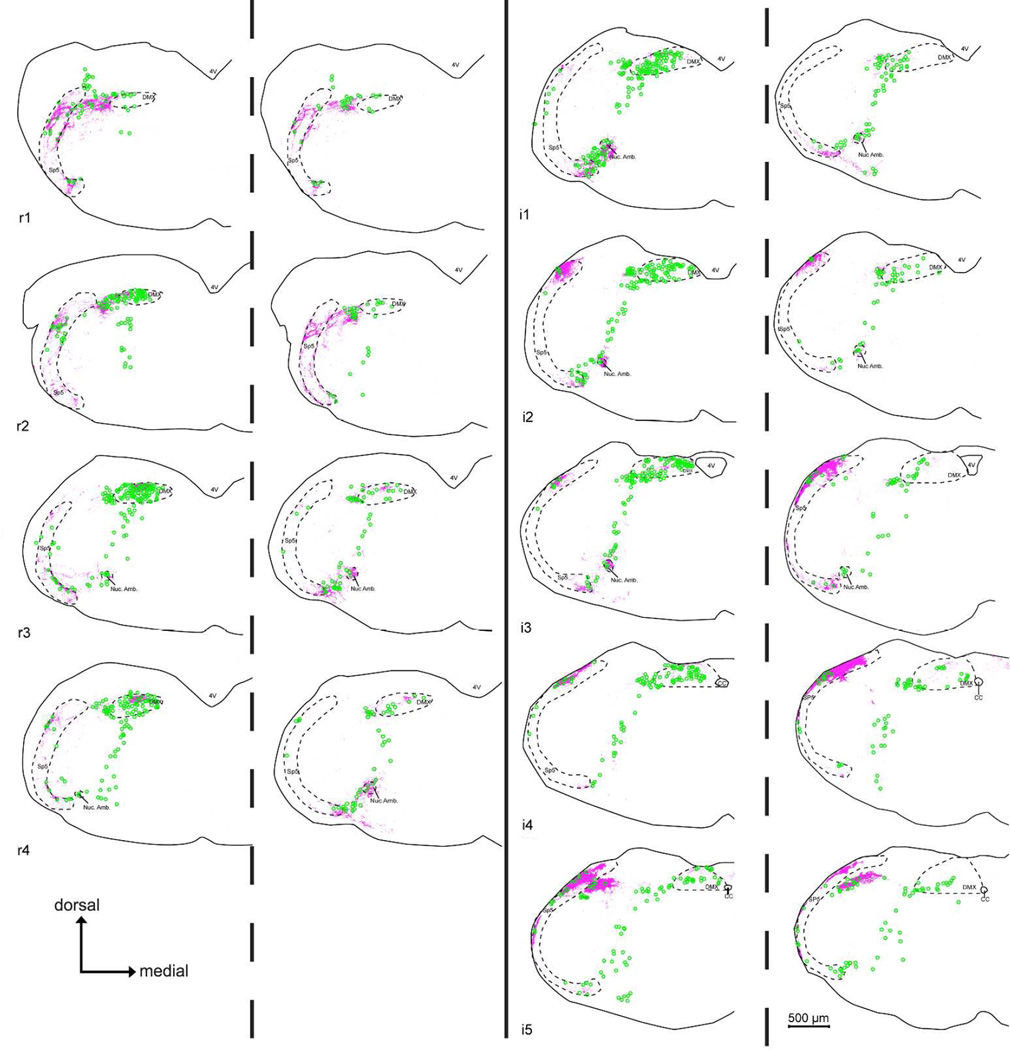
Figure 11. Comparison chartings of citric acid-evoked c-Fos-like Immunoreactivity (Fos-LI) within the brainstem of ‘Control’ (P2X WT) (Left side of each pair) and ‘Taste Blind’ (P2X-dbl KO) (Right side of each charting pair) mice.
Across all nTS levels, Fos-LI (green circles) is significantly reduced in the nTS of P2X-dbl KO mice compared to WT. In contrast, in non-nTS areas displaying high levels of CGRP-immunoreactivity (magenta fibers), including the dorsomedial trigeminal nucleus (DMSp5), spinal trigeminal tract (SP5), and the nucleus Ambiguus (Nuc. Amb.), Fos-LI density is similar between P2X WT and P2X-dblKO mice.

