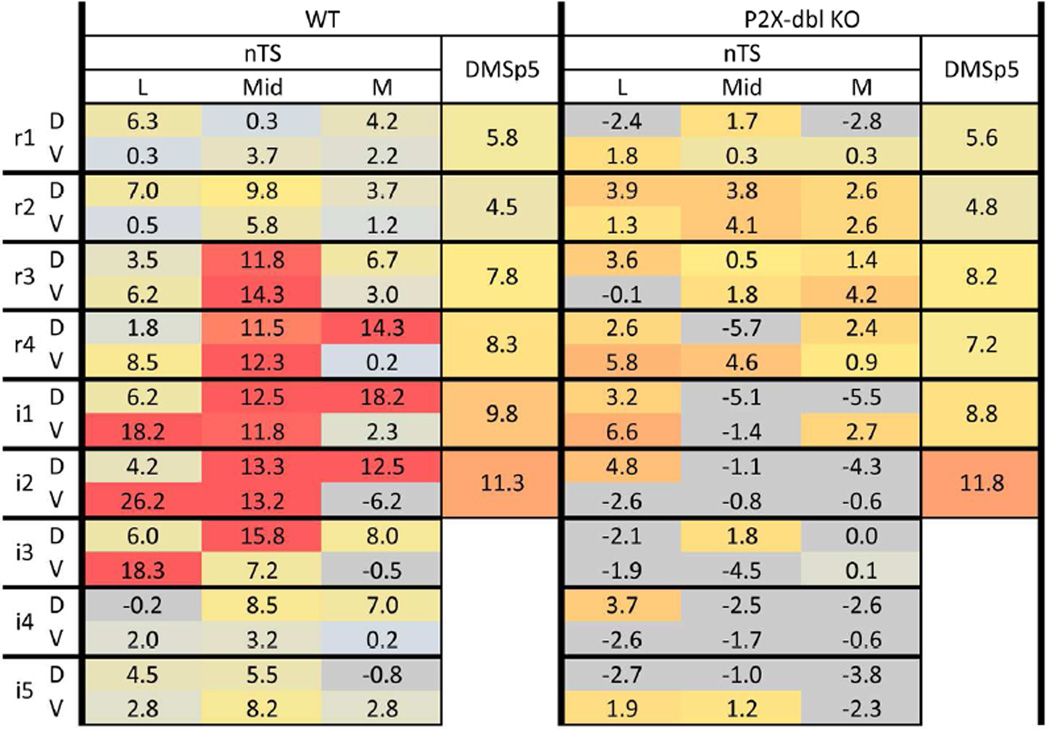
Figure 13. Spatial pattern ‘heat maps’ comparison of counts of citric acid- specific Fos-LI neurons within the brainstem of P2X WT and P2X-dblKO mice.
Left: citric acid- specific (raw count – avg. water) Fos-LI for P2X WT mice. Right: citric acid- specific (raw count – avg. water) Fos-LI for P2X-dblKO mice. Each 3×2 box within each major column represents one level of the nTS subdivided into the component subfields: lateral (L), Mid, medial (M) in dorsal (D) & ventral (V) tiers. Each heat map is color coded so that blue = minimal; red = maximal (> 15). For clarity, negative numbers (i.e. where citric acid Fos-LI was less than water-evoked Fos-LI) are shown as grey. All numbers represent the average value (n= 5 for P2X WT; n = 6 for P2X-dblKO) for each anatomical area (nTS subregion or DMSp5 region). In P2X WT animals, maximal activity in the Mid nTS levels r3 – i3 corresponds approximately to the RC subnucleus described by Ganchrow et al., 2014. In P2X-dbl KO mice, citric acid-specific Fos-LI was substantially reduced in nearly all nTS areas, except the RL division, which receives a substantial trigeminal CGRP input. Similarly, no reduction in Fos-LI occurred in the DMSp5 which also receives trigeminal CGRP inputs.

