Figure 4.
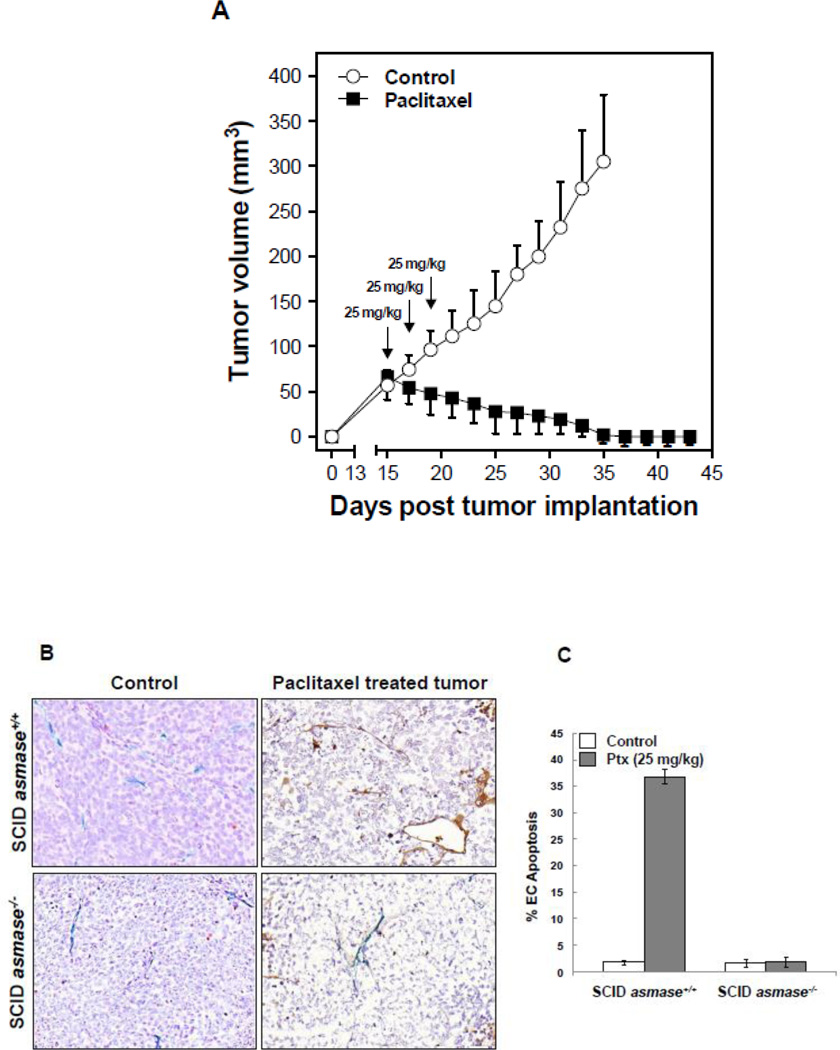
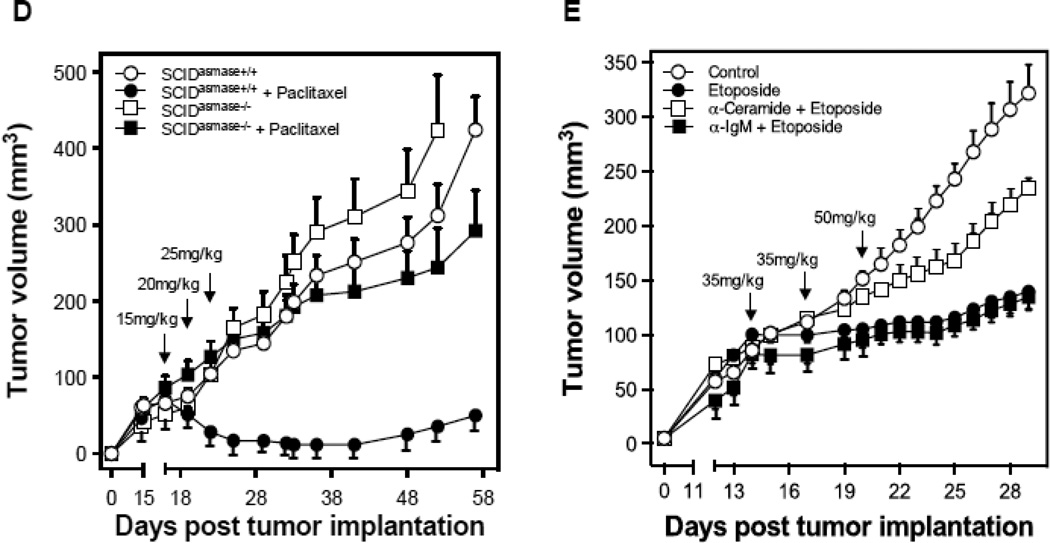
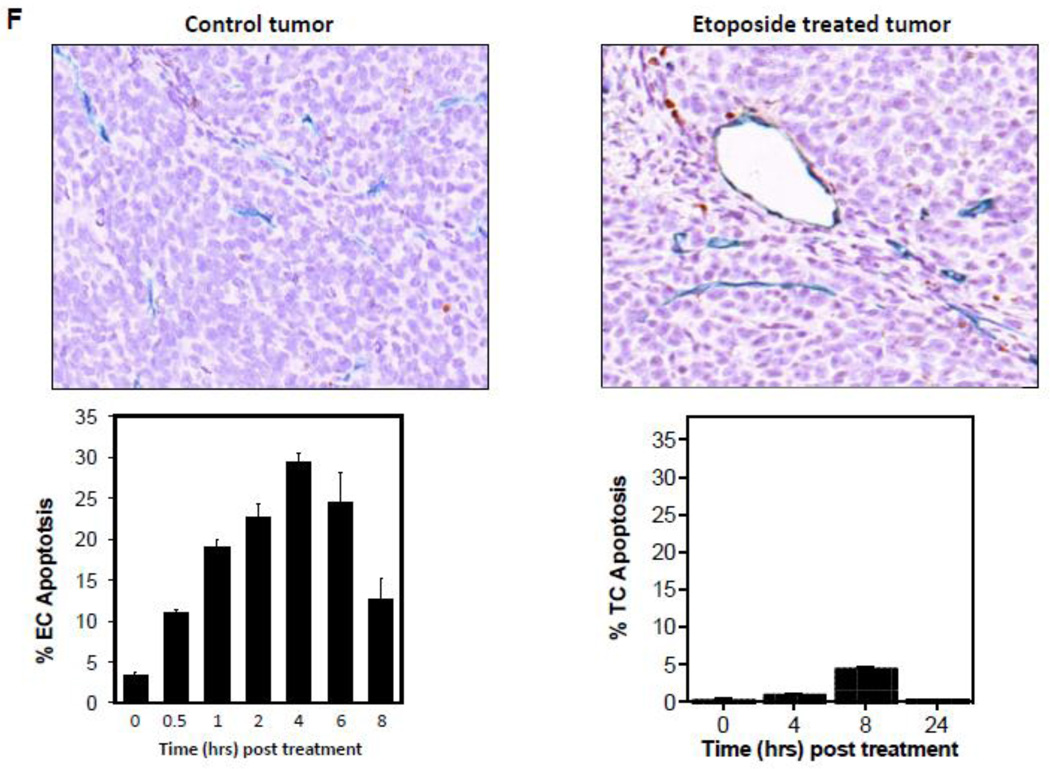
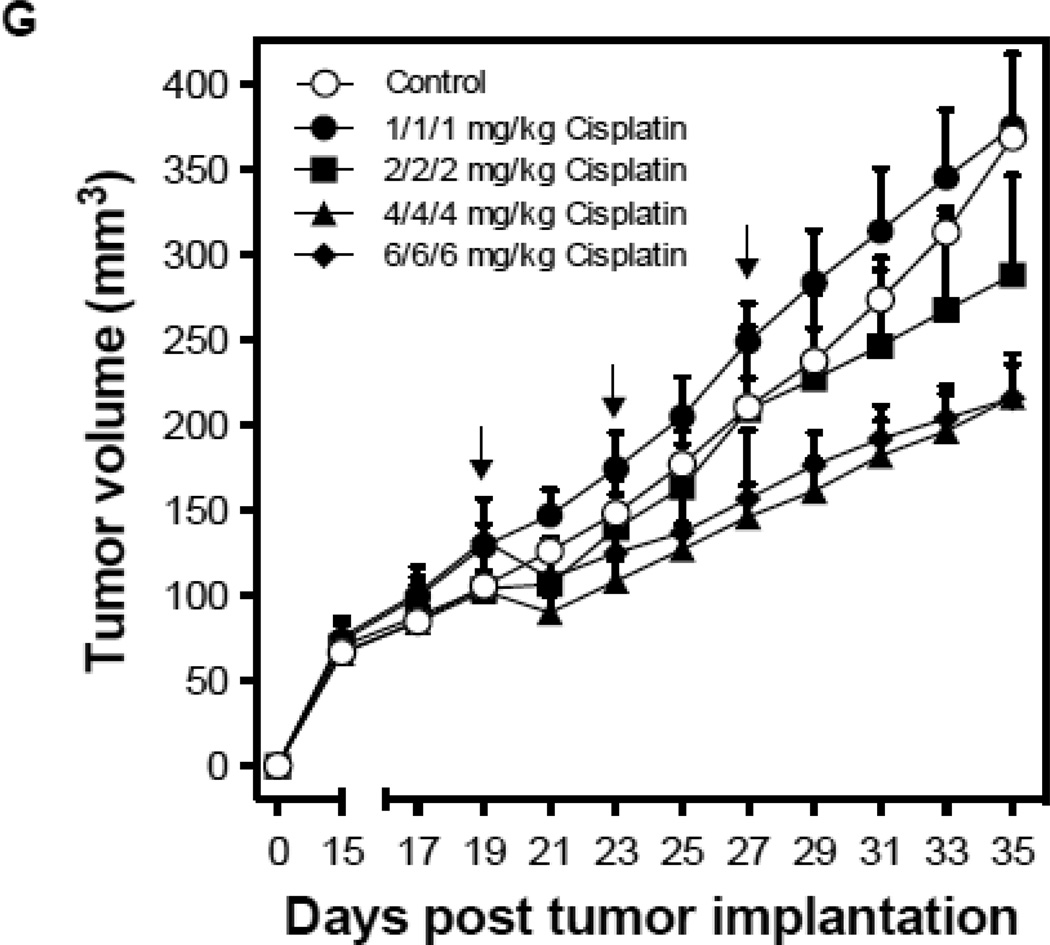
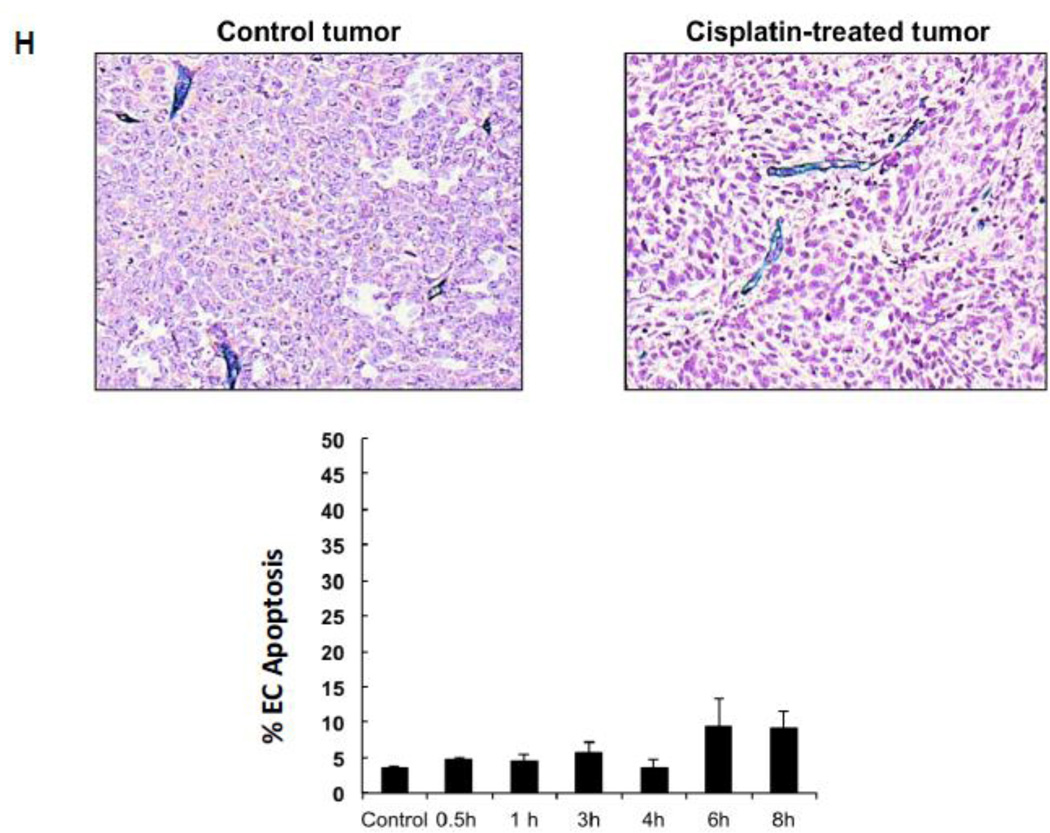
Endothelial cell response to chemotherapy in vivo. (A) Paclitaxel treatment of HCT-116 tumors. 3×10⁶ HCT-116 cells were implanted into the right flank of SCIDasmase+/+ mice. At tumor volumes of 50–70 mm3 mice were treated with paclitaxel (25 mg/kg i.p.) three times. Arrows indicate days of paclitaxel treatment. Data (mean±SD) are collated from 5 mice per group. (B) 3×10⁶ HCT-116 cells were implanted into the right flank of SCIDasmase+/+ or SCIDasmase−/− littermate mice. Fig. 3B shows representative 5-µm histologic tumor sections obtained either from controls (left panel) or at 4 hours after exposure of tumor-bearing mice to a single dose of paclitaxel (25 mg/kg i.p., right panel). Tumors were fixed and double-stained for endothelial surface marker MECA-32 (dark blue plasma membrane) and TUNEL (nuclear red-brown stain). Fig. 4C quantifies endothelial cell apoptosis after single dose paclitaxel. Data (mean±SD) were compiled from 20 fields (400× magnification) from 2–3 tumors. (D) 3×10⁶ HCT-116 cells were implanted into the right flank of SCIDasmase+/+ or SCIDasmase−/− mice. Mice harboring HCT-116 tumors (50–70 mm3) were treated with paclitaxel (15/20/25 mg/kg i.p.) three times biweekly. Arrows indicate days of paclitaxel treatment. Data (mean±SD) are collated from 5 mice per group. (E) SCIDasmase+/+ mice harboring tumors as in (D) were treated with etoposide (35/35/50 mg/kg i.p.) biweekly in the presence of anti-ceramide or isotype control antibody. Arrows indicate days of etoposide treatment. Data (mean±SD) are collated from 5 mice per group. (F) Representative 5 µm-histologic tumor sections, obtained from controls (upper left panel) or 4 hours after exposure to a single dose of etoposide (35 mg/kg i.p., upper right panel), were double-stained for endothelial cell surface marker MECA-32 (blue) and TUNEL (nuclear red-brown stain). Quantification of endothelial (bottom left) and tumor cell (bottom right) apoptosis in HCT-116 tumors occurred at different time points after treatment. Data (mean±SD) were compiled from 20 different fields (400× magnification) at each time point from 2–3 tumors. (G) Lack of cisplatin on HCT-116 tumor growth. 3×10⁶ HCT-116 cells were implanted into the right flank of SCIDasmase+/+ mice and tumor growth measured daily. Mice harboring 50–70 mm3 tumors were treated with 1, 2, 4 or 6 mg/kg cisplatin i.p. three times on a biweekly schedule. Arrows indicate days of treatment. Data (mean±SD) were collated from 5 mice per group. (H) Lack of cisplatin on endothelial apoptosis in HCT-116 tumors. 3×10⁶ HCT-116 cells were implanted into the right flank of SCIDasmase+/+ mice. Representative 5 µm-histologic tumor sections, obtained from controls (upper left panel) or 4 hours after exposure to a single dose of cisplatin (6 mg/kg i.p., upper right panel), were double-stained for endothelial cell surface marker MECA-32 (blue) and TUNEL (nuclear red-brown stain). Quantification of endothelial cell apoptosis in HCT-116 tumors at different time points after treatment as in (bottom center). Data (mean±SD) were compiled from 20 different fields (400× magnification) at each time point from 2–3 tumors.

