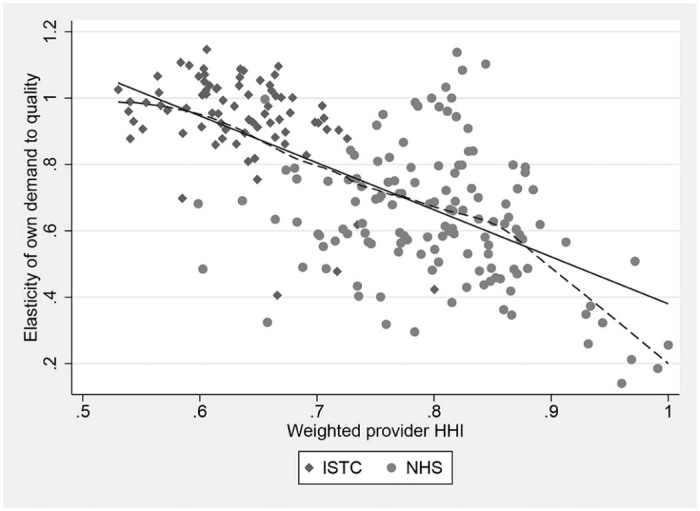
Fig. 3.

Differences in quality elasticity of demand between providers in competitive (low HHI) and non-competitive (high HHI) markets. Notes: Solid line shows best linear fit (Intercept = 1.80 (SE = 0.08), slope = −1.42 (SE = 0.10), R2 = 0.42). Dashed line shows LOWESS curve.
