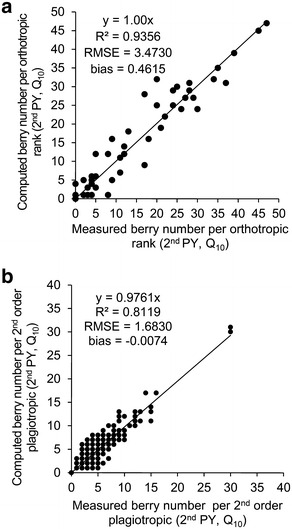
Fig. 4.

Validation of the Gaussian model for berry distribution. Comparison between measured and computed number of berries: a on 2nd order axes inserted along orthotropic trunk and b along ranks of 2nd order axes. Example of square planting pattern and 10,000 plants per ha−1—Q10 dataset in the 2nd production year
