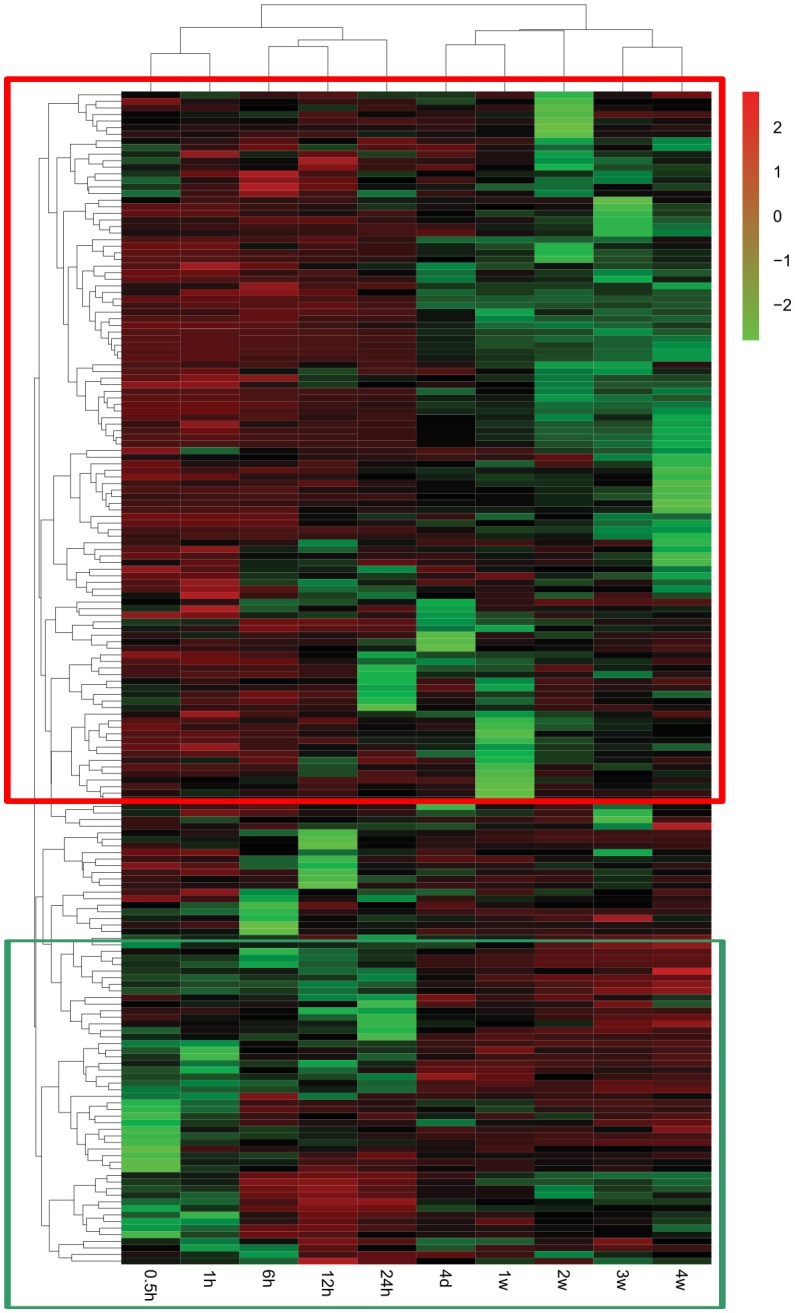
Figure 4.

Heatmap and hierarchical clustering of genes involved in Nervous System Development and Function. The expression levels of genes were indicated by the color bar above the heatmap. Red color indicates the increased expression whereas green color indicates the decreased expression as compared to control (expression at 0 h). Genes that were first up-regulated and then down-regulated are boxed in the red frame while genes that were first down-regulated and then up-regulated are boxed in the green frame.
