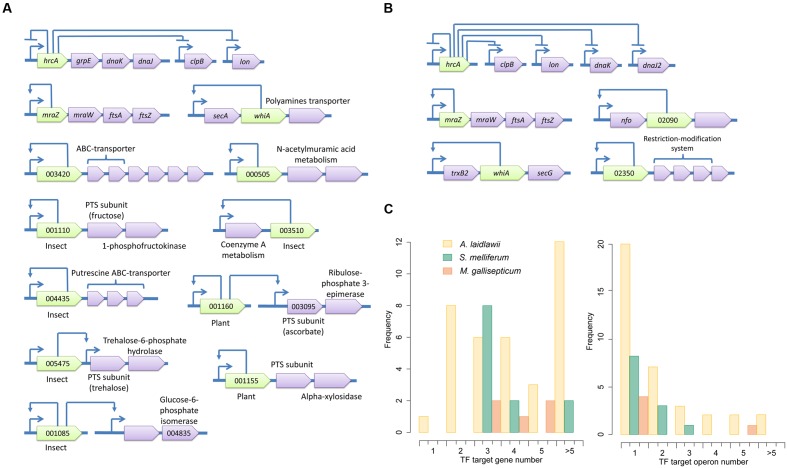
FIGURE 6.
Transcriptional regulons of S. melliferum(A) and M. gallisepticum (B). Green genes represent TFs with predicted binding sites, violet genes are target genes and orange genes are non-transcriptional regulators. TSSs of operons are shown by arrows upstream of the genes; other arrows show predicted regulatory relationships between genes. (C) The summary of TF-controlled genes and operon numbers in three species.

