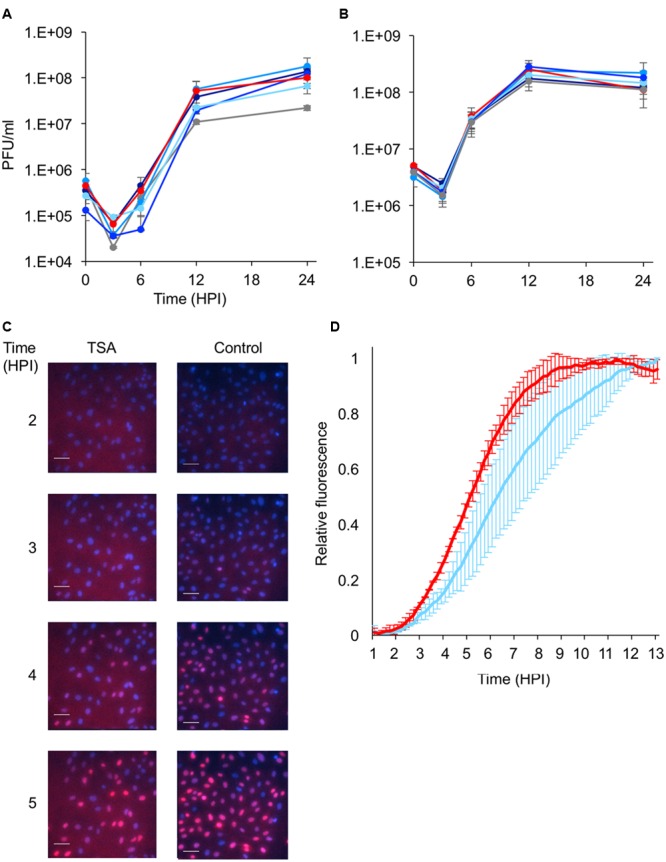
FIGURE 2.

Effect of histone modifying enzyme inhibitors on the viral replication kinetics. (A,B) Vero cells were infected with an even mixture of the three fluorescent expressing HSV-1 recombinants at MOI 10 (A) or 100 (B), in the presence or absence of different inhibitors, and at different time points post-infection, progeny viruses were collected and assayed for titer. The infected cells were incubated with different inhibitors (color coded as in Figure 1), 3 h prior to infection. Each point is an average of viral titers obtained from three technical replicates. Error bars show standard deviations. (C,D) Vero cells were infected with an mCherry expressing recombinant at MOI 100 in the presence or absence of TSA. The cells were visualized every 10 min from 1-h post-infection. (C) Representative images at the indicated time-points are shown. Cell nuclei were stained with Hoechst (blue) and mCherry expression from the virus was monitored (red). Scale bars 50 μM. (D) Each line represents the average relative fluorescence accumulation from two different experiments (color coded as in Figure 1). In each experiment two wells were monitored (technical repeats), in each well 3–5 frames were analyzed. A total of more than 200 individual cells were collected from each well. Error bars show standard deviations between the two experiments.
