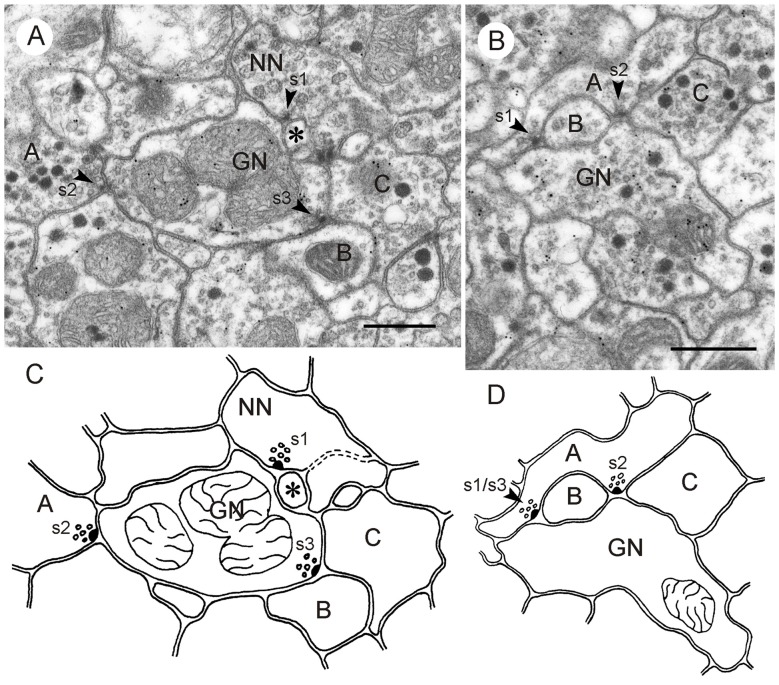
Figure 7.
GABA-immunoreactive neurons with input and output synapses. (A,C) Section five out of five consecutive immunogold-labeled sections through the CBL (A) and corresponding schematic diagram of synaptic contacts (C). A neuron with granular vesicles (NN) makes an input synapse of type I (s1, arrowhead) with the GABA-immunoreactive neuron and a second small profile (asterisk). Although NN had a relatively small diameter, it is most likely not immunolabeled because it contained no GP in any of the five sections. NN receives a second synaptic input from a profile with small clear and dark dense core vesicles (s2, arrowhead); its immunostaining could not be determined. Finally, GN is presynaptic to two other profiles (s3, B, C), illustrating serially synaptic connections of GN. The mean GP densities (n = 5) were 13.3 ± 6.0 GP/μm2 (GN), and for a second profile not shown 1.6 ± 1.4 GP/μm2. The GP densities in GN were significantly different from those of the second profile (t-test, p = 0.0031). (B) Section two out of five consecutive immunogold-labeled sections through the CBL. The GABA-immunoreactive profile receives dual synaptic input (s1, s2 arrowheads). In synapse s1, profile A is presynaptic to GN and a non-classified profile B (type I synapse). Synapse s2 might be a triadic synapse with one non-classified presynaptic profile (A) facing three postsynaptic profiles (GN, B, C). In the first section of this series, however (not shown), only profiles B and GN seemed to be postsynaptic to A. The mean GP densities (n = 5) were 18.4 ± 12.7 GP/μm2 (GN), and for a second profile with granular vesicles and small clear vesicles not shown 1.6 ± 1.5 GP/μm2. The large standard deviation of GP density of GN resulted from very low GP densities on one out of the five sections. Perhaps this section was not sufficiently exposed to the primary or secondary antibody (e.g., by an air bubble between section and incubation medium). The GP densities in GN were significantly different from those of the second profile (t-test, p = 0.02). (D) Schematic diagram of synaptic contacts of the series in (B). Synapse s3 occurred on section 5 of the series at the same site as synapse s1, but with two sections (3 and 4) in between without synaptic contact. Scale bars: 0.5 μm.

