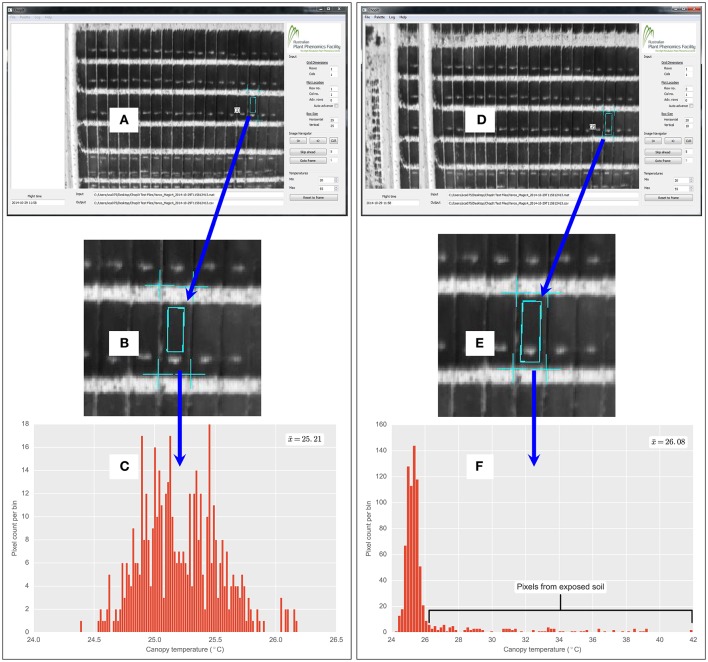
Figure 3.
Custom developed ChopIt airborne thermography image processing software. Demonstration of quality control by user and flexibility of image analysis protocol, whereby the user can manually exclude exposed soil patches within a field plot. In this example, exposed soil patch is from biomass sample taken earlier on a 2 × 6 m field plot of wheat. (A) ChopIt user interface, where user has avoided exposed soil within the plot. (B) Magnified view showing exposed soil patch. (C) CT histogram is therefore void of pixels from the exposed soil patch. Compare with (D), where for the same plot as (A), user has included the exposed soil, evident in magnified view (E) and pixels from the soil patch are evident in the CT histogram (F). Where denotes the respective mean for (C,F). The from (C) is 0.87°C cooler than (F).

