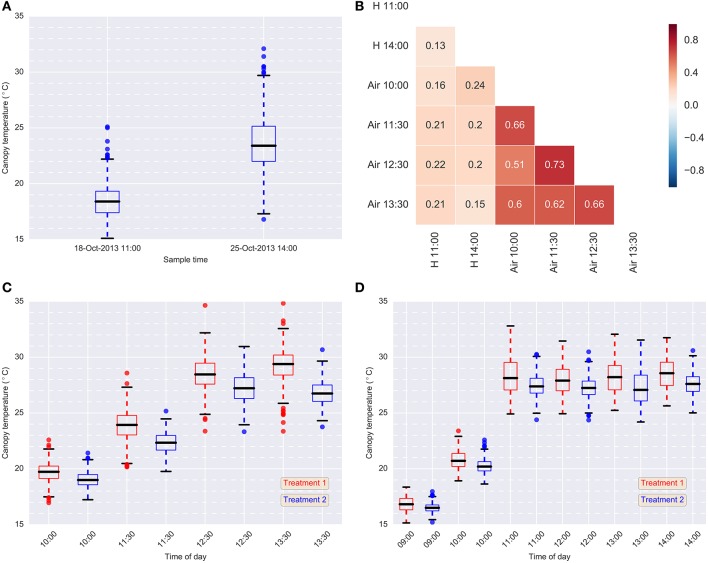
Figure 5.
Data summary. (A) Box-plots of hand-held CT data for each sample event in 2013 (Treatment 2 only); (B) Pearson correlations between hand-held CT, H, (18-Oct-2013 11:00 and 25-Oct-2013 14:00) and airborne CT, Air, (24-Oct-2013) (Treatment 2); (C) box-plots of airborne thermography CT data for each flight time and treatment on 24-Oct-2013; (D) box-plots of airborne thermography CT data for each flight time and treatment on 2-Oct-2014. Each box-plot represents CT data from 384 experimental plots (384 experimental plots per treatment and 768 experimental plots in total). Airborne CT for each experimental plot was derived using M1: mean of all pixels (no pixels discarded). In (C,D), Treatment 2 was consistently cooler than Treatment 1, owing to the greater water limitation applied to Treatment 1. In Treatment 2, irrigation was supplied to achieve the equivalent of a decile eight rainfall (wettest 20% of years) for the site, while in Treatment 1, irrigation was supplied to achieve a water limitation close to the long-term climate median for the site.

