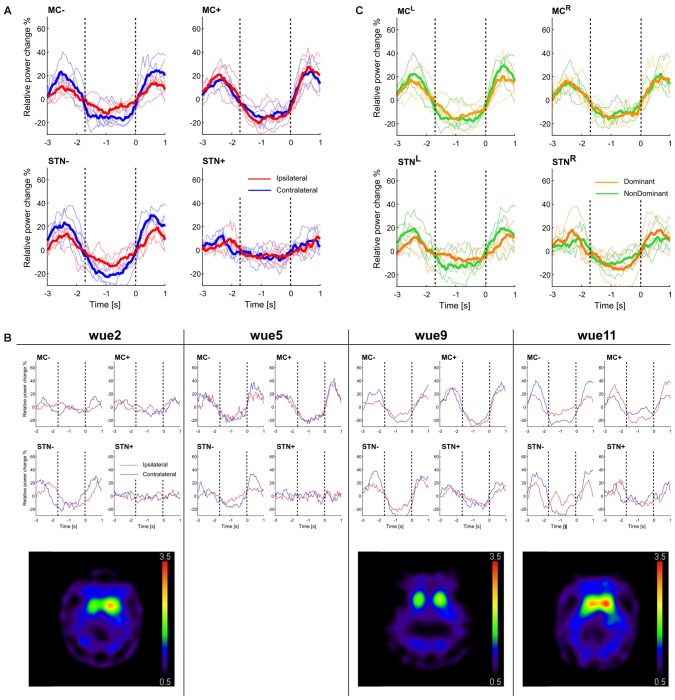
Figure 1.
Beta-rebound and striatal dopaminergic denervation. (A) Movement-related beta-modulation with respect to the more and less dopamine-depleted hemisphere. The blue lines represent the movement performed with the hand contralateral to the examined brain structure, red lines with the ipsilateral one. Solid lines represent the average across subjects and thin lines the beta-modulation of each subject. The super-imposed vertical dotted line at 0 s shows the return time (RT). We also indicated with a dotted line at −1.7 s the mean onset time (OT) of all trials (see also Figure S1), as a rough indication of movement OT. (B) Movement-related beta-modulation for each subject across all valid trials and the corresponding [123I]N-ω-fluoropropyl-2β-carbomethoxy-3β-(4-iodophenyl)nortropane (FP-CIT) and single-photon computed tomography (SPECT) images. (C) Movement-related power change in left and right (MCL and MCR) and subthalamic nucleus (STNL and STNR). The yellow lines represent the movement performed with the dominant hand, the green lines with the non-dominant one. Solid lines represent the average across subjects and thin lines the beta-modulation of each subject. Values are reported in Table 4.

