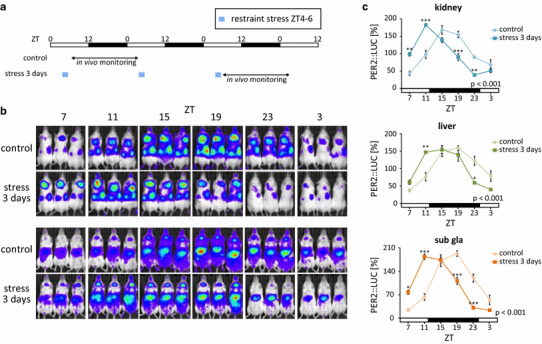
Fig. 2.

Stress-induced phase shift of peripheral PER2::LUC rhythms. a Experimental schedule; 2-h restraint stress was performed for 3 days at Zeitgeber time (ZT)4–6 in PER2::LUC mice and, subsequently, the rhythm of in vivo bioluminescence was monitored. b Representative images of in vivo PER2::LUC bioluminescence in kidney (upper panels), liver, and submandibular gland (sub gla) tissues (lower panels). c Normalized PER2::LUC oscillations in control and stress groups show phase advancement in the stressed group. Values are expressed as mean ± SEM. The P values shown on the lower right side of the graphs indicate the results of two-way ANOVA (with Tukey post hoc test) between the control and stress groups. *P < 0.05, ***P < 0.001 (modified from [16])
