
Fig. 3.
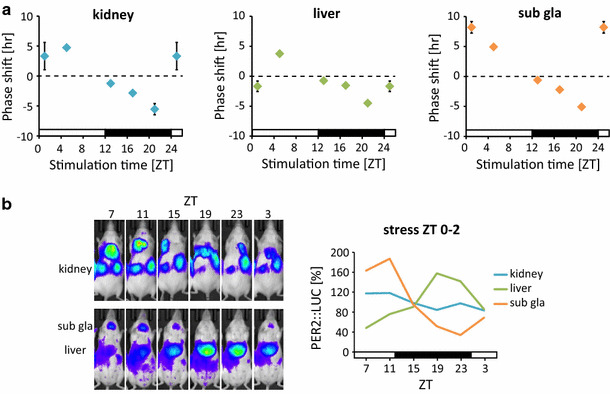
Time-of-day dependence of circadian changes in response to restraint stress. a Phase-response curves of the response of peripheral clocks to 2-h restraint stress at Zeitgeber time (ZT)0–2, 4–6, 12–14, 16–18, and 20–22 (PER2::LUC rhythms). Increased and decreased phase shifts indicate phase-advance and -delay, respectively. Data for ZT25 were copied from ZT1. Graphs include all rhythmic and arrhythmic data. b Representative images of in vivo PER2::LUC bioluminescence (left) and normalized waveforms (right) after restraint stress at ZT0–2 for 3 days (modified from [16])