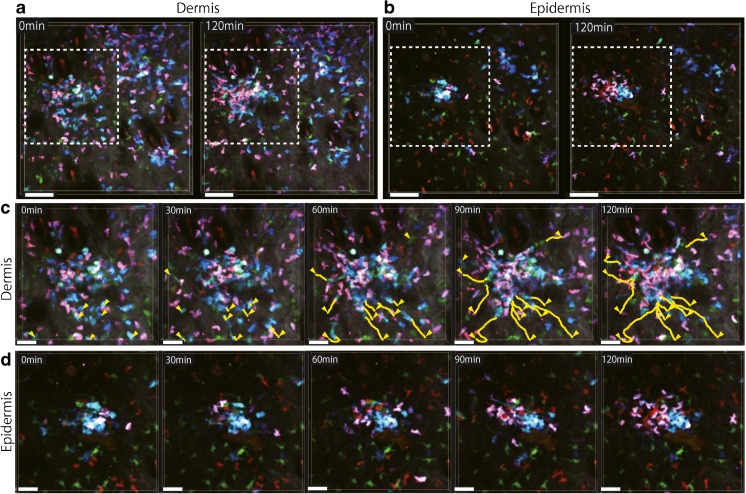
Fig. 1.
Multicolor imaging of dendritic cells and T cells in the mouse model of contact dermatitis by intravital multiphoton microscopy. Chicken ovalbumin-reactive T cell receptor transgenic CD4+ T cells expressing tdTomato plus EGFP (pink to purple) and CD8+ T cells expressing tdTomato (red) were transferred to an Xcr1 gfp/+ CD11c-YFP mouse for visualization of their interactions with XCR1+ dendritic cells (light blue) and other dendritic cells (green) [9]. The mouse was subcutaneously immunized in the flank with ovalbumin plus poly (I:C). Four days after immunization, the mice were then intradermally injected in the dorsum of foot with ovalbumin alone. Seven days later, the mouse was anesthetized, and the skin of the dorsum of foot was imaged on an inverted multiphoton microscope with four external detectors. Excitation wavelength was 910 nm. a Projection images of ten z-slices of the dermis (33–60-μm depth from the skin surface) at the beginning and end of the 2-h recording. Scale bar: 80 μm. Collagen fibers (white) were also visualized by second harmonic generation. b Projection images of four z-slices of the epidermis (12–21-μm depth from the skin surface) at the same x-y position as a. The scattered epidermal dendritic cells in green are mostly Langerhans cells. c, d Time-lapse images of the region indicated by dotted lines in a and b. Scale bar: 40 μm. Yellow lines in c are paths of dendritic cell migration tracked every minute. Yellow arrowheads indicate starting positions of the tracks

