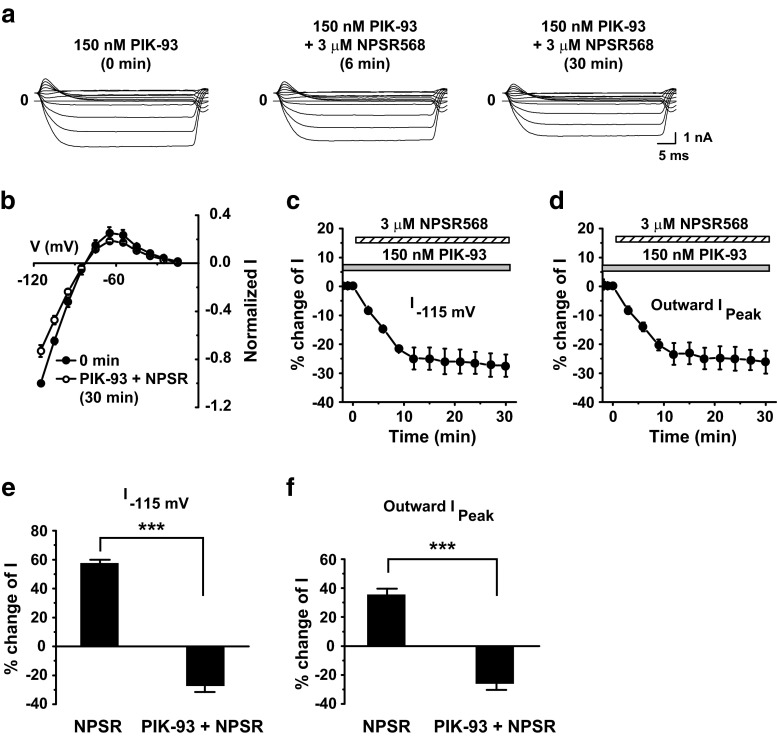
Fig. 10.
Effects of PIK-93 on NPSR568-induced increases in I K1. a Effects of NPSR568 with 150 nM PIK-93 pretreatment (10–15 min) on I K1 recorded from a guinea pig ventricular myocyte. b Voltage dependence of normalized I K1. c, d Time courses of averaged changes in I K1 induced by 3 μM NPSR, showing currents recorded at −115 mV (c) and peak outward currents (d) with 150 nM PIK-93 pretreatment. e, f Quantification of results in c, d, showing the percent change in currents recorded at −115 mV (e) and peak outward currents (f) induced by 3 μM NPSR568 alone (n = 6) and by 3 μM NPSR568 plus 150 nM PIK-93 pretreatment (n = 4)

