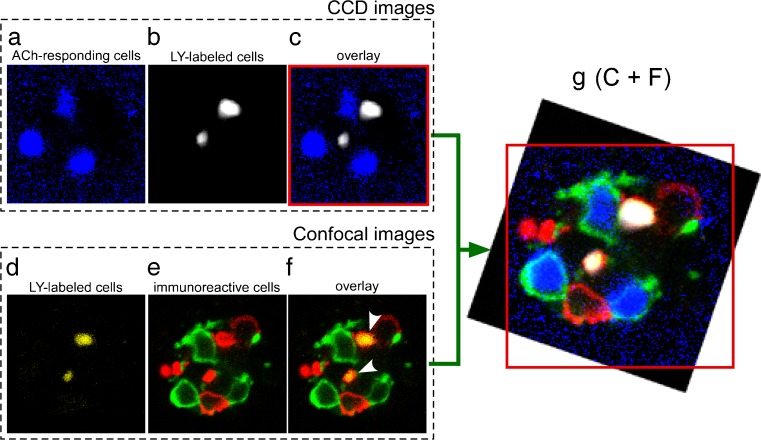
Fig. 2.
Positional relationships among ACh-responding cells, LY-labeled cells, and immunohistochemical cell types in the same taste bud. a Monochrome image of ACh-responding cells shown in Fig. 1a (3–2). b Image of LY-labeled cells. c Overlay with a red outline on the frame. d Confocal image of LY-labeled cells in the same taste bud shown in a–c. e Confocal image of immunoreactive cells. f Overlay. g Overlay of c and f, where f is rotated to superimpose LY-labeled cells. As shown by the red outline, the four corners of c have been eliminated. ACh-responding cells, blue; LY-labeled cells, white in images b, c, and g, and yellow in images d, f, and g; PLCβ2-immunoreactivity, red; SNAP-25-immunoreactivity, green. Arrowheads in f show the overlap of PLCβ2 and LY. It should be noted that images d–f were acquired after fixation for immunohistostaining (color figure online)

