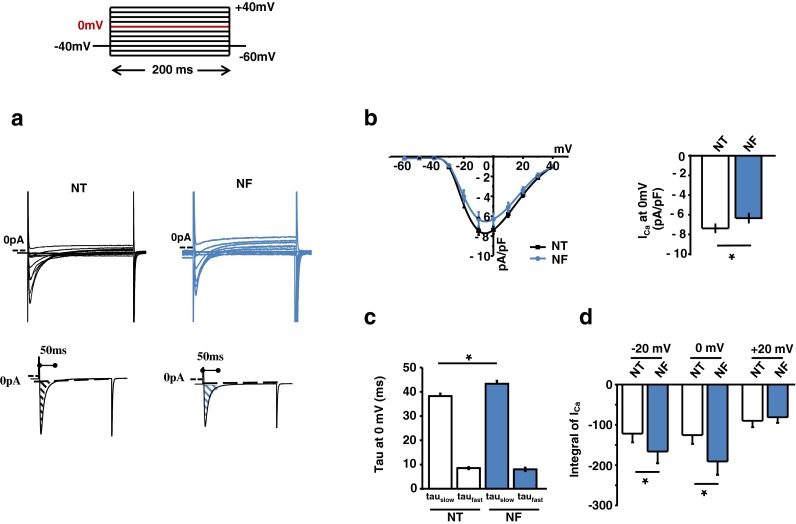
Fig. 3.

Patch-clamp recordings of LTCC activities in NF. a, b Pulse protocol, representative ICa and the corresponding I-V relationship, peak ICa at 0 mV, inactivation parameters, and the integral of Ca2+ influx in NF. NF reduced peak ICa density, prolonged slow inactivation of ICa, and increased integral of ICa at 0 mV and −20 mV
