
Fig. 8.
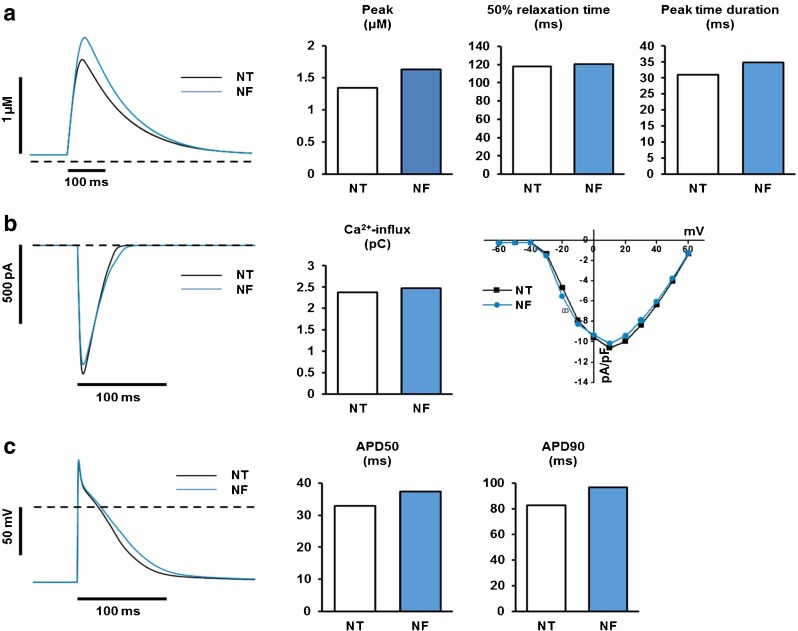
Simulated effects of NF on electrical properties and Ca2+ regulation of rat ventricular myocytes. Ca2+ transient morphology (a), ICaL (b), and APD (c), a Simulated effects of NF on morphology and relaxation time of Ca2+ transient. Measurements of 50 % relaxation time and peak time duration were conducted in the same way as those in Fig. 2b. The dashed line indicates 10 nM [Ca2+]i level. b Simulated effects of NF on ICaL and Ca2+-influx through ICaL. The left panel shows the effects of NF on ICaL during AP. The middle panel compares the total Ca2+ influx through ICaL between NT and NF. The right panel shows the effects of NF on ICaL density obtained by a voltage-clamp protocol used in animal experiments (see Fig. 3b). The dashed line indicates zero current level. c Simulated effects of NF on morphology and duration of AP. Pacing frequency is 1 Hz. APD50 was calculated as the difference between time at 50 % depolarization and time at 50 % repolarization. APD90 was calculated as the difference between time at 10 % depolarization and time at 90 % repolarization. The dashed line indicates zero voltage level