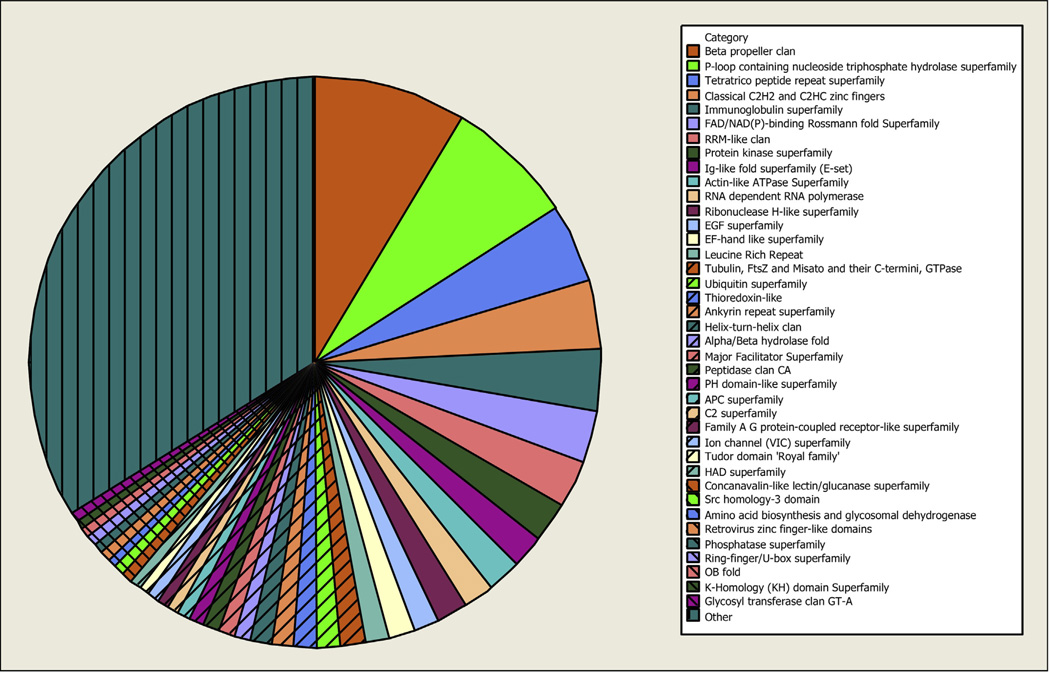
Fig. 3.
Chart showing the most common Pfam clans identified in the cattle tick synganglion transcriptome. Each contig of the Texas cattle tick synganglion transcriptome was translated in all 6 reading frames. ORFs of ≥50 amino acids were submitted for Pfam analysis and the resulting clans are shown in the pie chart. Pie slice sizes represent the number of times that a specific clan occurs in the population of all clan occurrences. Clans with occurrences <0.5% of the total were grouped into the “Other” category.

