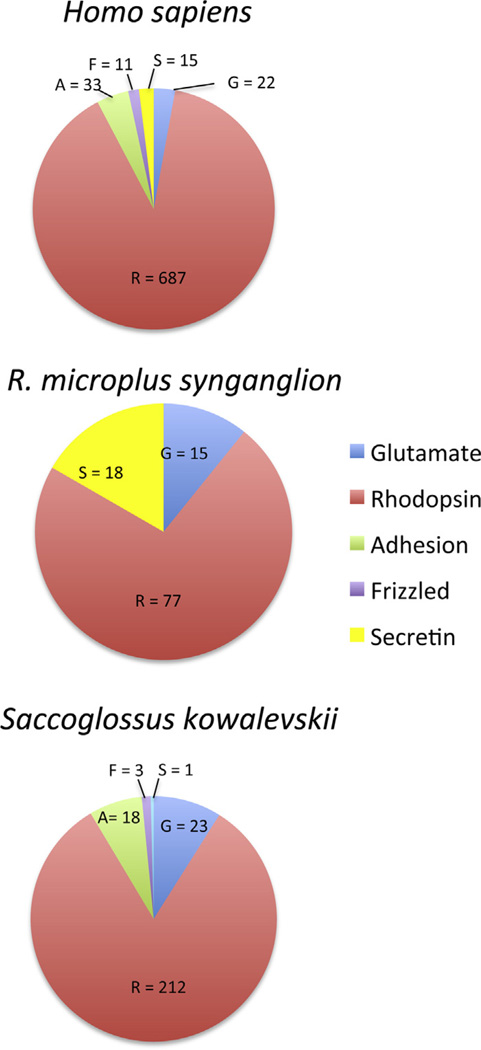
Fig. 5.
Distribution of GPCRs in the GRAFS classification system. The number of GPCRs in each of the Glutamate (blue), Rhodopsin (red), Adhesion (green), Frizzled (purple) and Secretin (yellow) families from H. sapiens, S. kowalevskii, and R.microplus synganglia are noted. The number of GPCRs from each family are shown in the relevant sections of the pie charts. (For interpretation of the references to color in this figure legend, the reader is referred to the web version of this article.)

