
Figure 2.
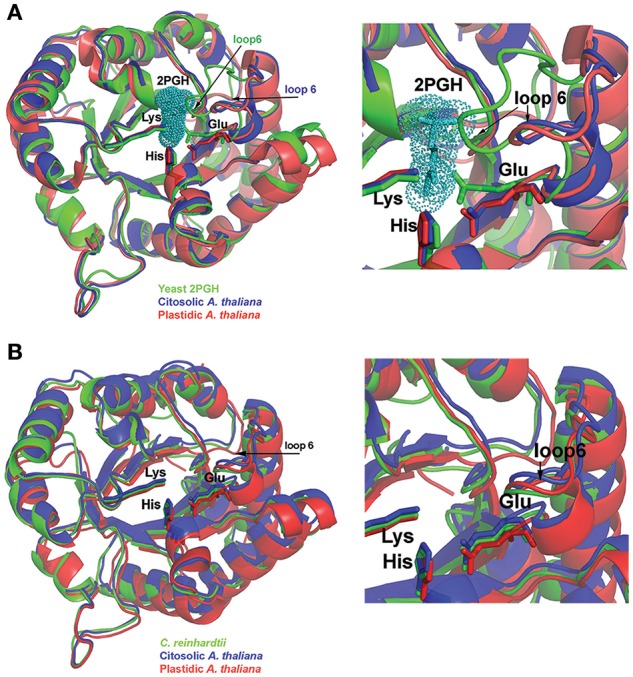
Structural comparison between AtTPIs and other TPIs. (A) Structural comparison between AtTPIs and yeast TPI in complex with PGH. PGH is depicted in a van der Waals representation and the catalytic residues Lys, His, and Glu are represented in a ball-stick representation. A zoom of the superimposition (right) denotes that AtTPIs crystallized in an open conformation in which loop 6 is moved out of the active site. (B) Superimposition of cTPI, pdTPI, and CrTPI. The catalytic residues Lys, His, and Glu are in a stick representation. A closer look at the active site (right) illustrates the positions of loop 6 and catalytic Glu between open and closed conformations.