
Figure 6.
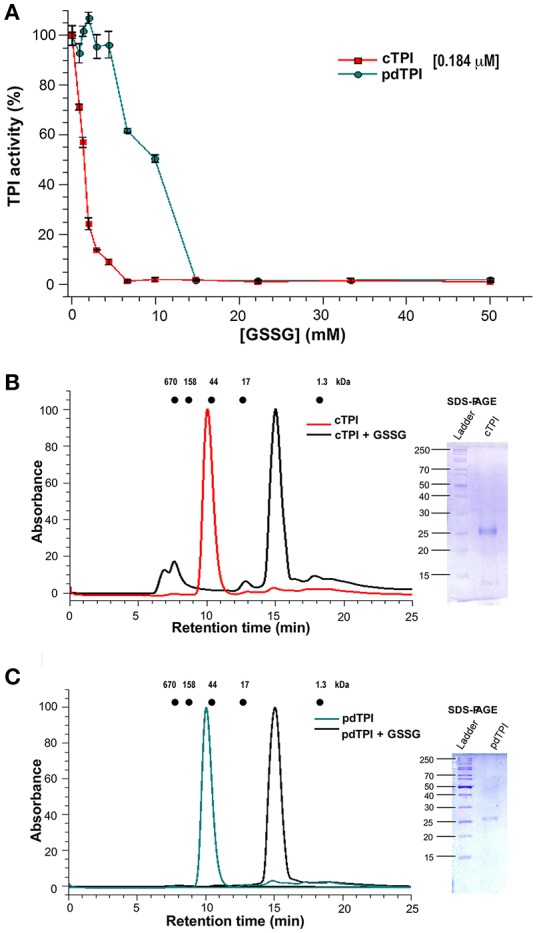
Differential effect of GSSG on the enzymatic activity of AtTPIs and dimer stability. (A) Effect of GSSG on the enzymatic activity of cTPI (red) and pdTPI (green) after 3 h of incubation at 25°C with increasing concentrations of oxidized glutathione (0–25 mM). The results are expressed as a percentage of the activity with respect to the untreated protein sample. (B,C) Effect of addition of GSSG on the oligomerization of AtTPIs. (B) Size-exclusion profile showing the effect of the addition of GSSG on cTPI dimer stability. The non-derivatized enzyme is shown in red, whereas the GSSG incubated enzyme is shown in black. The SDS-PAGE shows the molecular weight of collected fractions of the cTPI-GSSG peak. (C) Size-exclusion profile showing the effect of the addition of GSSG on the pdTPI oligomeric profile. The non-derivatized enzyme is shown in green and the GSSG treated enzyme is shown in black. The SDS-PAGE shows the molecular weight of collected fractions of the pdTPI-GSSG peak. The elution profiles for MW standards; thyroglobulin (670 kDa), γ-globulin (158 kDa), ovalbumin (44 kDa), myoglobin (17 kDa), and vitamin B12 (1.35 kDa) are represented as dots.