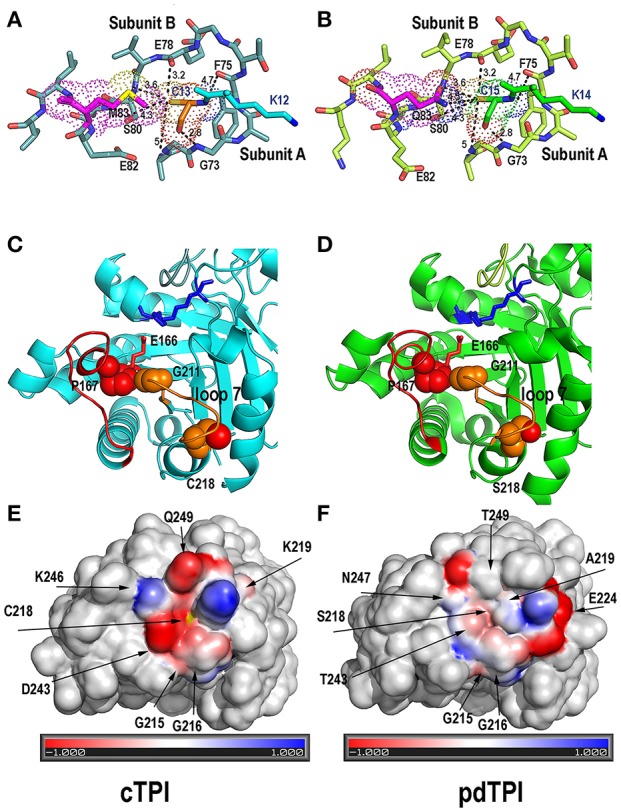
Figure 8.

Structural rationale for cTPI susceptibility and pdTPI resistance to redox agents. (A,B) Close-up of the interface between loop 1 cysteine (cTPI-C13 or pdTPI-C15) and loop 3 from the neighboring subunit. Loop 1 cysteine is displayed in a ball-stick representation and colored in orange (cTPI-C13) or green (pdTPI-C15). A conserved set of interactions between residues G73, S89, E78, and F75 of the neighboring AtTPI subunit is displayed. cTPI-C-13 forms a hydrophobic interaction with cTPI-M13, whereas pdTPI-C15 has the potential to form a H-bond with pdTPI-Q83. (C,D) Close Up of the α-helix 7 AtTPIs showing residues cTPI-C218 (C) and pdTPI-S218 (D) in a surface representation. The thiol and hydroxyl groups of cTPI-C218 and pdTPI-S218 are colored in red. Both residues are located near residue G211 of the YGGS motif that makes contact with residue P167 located immediately before the catalytic E166. The structural localization of cTPI-C218 predicts that alterations in its integrity maybe transduced to the catalytic E166. (E,F) Electrostatic potentials near residues cTPI-C218 and pdTPI-C218. Positively charged amino acids are colored in blue, negatively charged amino acids in red. The thiol group of cTPI-C218 is colored in yellow.
