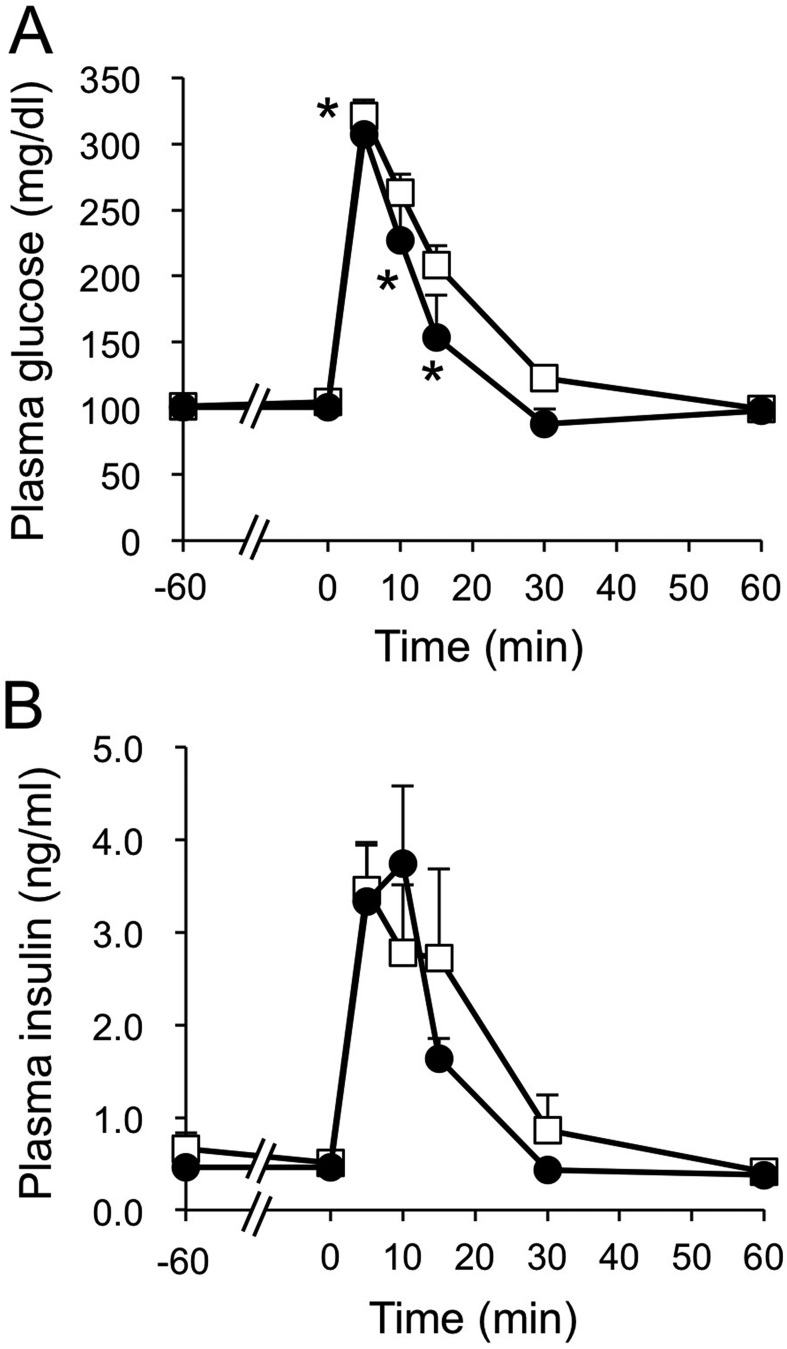
Fig. 3.
Plasma glucose (A) and insulin (B) concentrations after intravenous administration of glucose with or without the oral administration of D-allulose in dogs. Closed circles and open squares represent data from dogs administered D-allulose (0.2 g/kg) and control dogs, respectively. Data are shown as means ± standard error of the mean (SEM) (n=6). Asterisks represent significant difference (P<0.05) between groups.

