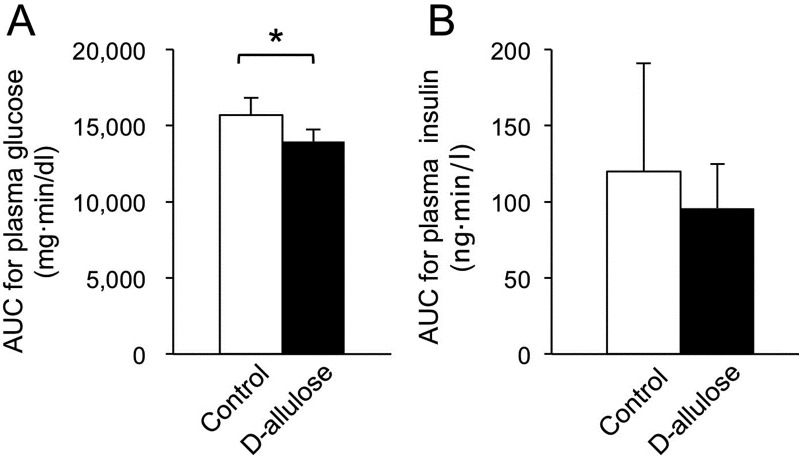
Fig. 4.
Area under the curves (AUCs) for plasma glucose (A) and insulin (B) concentrations after the intravenous administration of glucose with or without the oral administration of D-allulose in dogs. Data are shown as means ± standard deviation. Asterisks represent significant difference (P<0.05) between groups.

